If your brand has a business Facebook page, you'll want to invest time understanding your Insights dashboard.
It holds important data that helps you understand how your page is performing and is key to growing your page.
Features like weekly insight summaries and competitive data on other business pages make Facebook Insights a powerful tool that every marketer should leverage.
Let's dive into what Facebook Insights is, how to access it, and how to interpret the metrics it tracks.
Facebook Insights is an analytics dashboard where you can track user behavior and post performance on your Facebook business page. In addition to providing key metrics like page views and post reach for paid and organic posts, the platform also recommends competitor pages to watch and track.
Despite having similar names, Facebook Insights and Facebook Audience Insights have completely different functions.
Facebook Insights visualizes incoming data from your business page so you can learn how users are behaving on your page, what content they're engaging with, and how your page matches up to competitors.
Facebook Audience Insights, on the other hand, is used for ad campaigns and helps marketers understand Facebook audiences in general (which can also include those who follow your page).
The platform includes information on user demographics, such as location and relationship status as well as user behavior, including average ad clicks and comments.
To access Facebook Insights, you'll need to have a business page. Then, follow the steps below:
 However, you can also view data from today, yesterday, and the last 28 days.
 The Facebook Insights API, also known as the Ads Insights API, allows you to fetch ad data to track your ad performance. The API is particularly useful because it allows marketers to pull the exact data they want to track, no matter how granular.
To fetch the data from the API, you must determine what data you want to pull and create an access token for that ad, so that only your team can access that information. You'll then need to determine where to import that data, like Google Sheets or HubSpot's ads software within the Marketing Hub.
It allows you to pull your Insights API into the platform and match it against with data already in the CRM. This will provide a better understanding of the customer journey and give you a 360-degree view of how your ads are performing.
Your Facebook Insights dashboard displays top metrics about your business page. On any given day, you can get a snapshot of your page's performance and adjust your strategy accordingly. Top metrics include:

You also have video insights, which can tell you how your videos are performing. Key metrics include:
For tips on how to interpret your video insights, jump to this section.
Before you start analyzing your data, make sure you know what questions you want answered. This will help you narrow down which key metrics to focus on.
Once you know that, start looking through the data to identify patterns.
For instance, let's say you notice that your how-to posts get shared at a much higher rate than your other content.This may indicate that this type of content resonates more with your audience and adds value to them and their community. As such, you may want to double down on these posts if your goal is to get higher engagement.
Analyzing the data is one thing, but what's more important is what you do next. As you notice trends, take note of them and conduct experiments to learn more about what your audience wants. This will help you learn more about your audience and develop content that meets their needs.
If your team wants to focus on video insights, scroll down to the "Videos" tab on the left sidebar and click on it. Once there, you'll see your top video metrics, such as watch time and top video performers.
For tips on how to understand your video insights, watch the video below. It dives into how to navigate your video insights dashboard and what your insights can tell you broken down by performance, loyalty, audience, and retention.
Your Facebook Insights dashboard holds so much information about your page's performance and your audience. If you leverage that data, you can create better content and generate more revenue for your brand.
Topics: Facebook Marketing
Facebook Insights is one of the most powerful Facebook marketing analytics tools available.
When you dive into your Facebook Insights, you’ll receive a wealth of data to help you understand more about your Facebook Page.
With so many different data-points available to measure — such as Likes, engagement, reach, and demographics — Insights will help you to understand how your content is resonating with your audience, how your Page is growing and provide you with an awesome overview of how your Facebook strategy is performing.
This complete guide will cover everything you need to know about the key sections of Facebook Insights and share tips to help you become proficient with Facebook analytics.
💡
Schedule your Facebook posts and save time with Buffer
Plan, schedule, and analyze your posts to Facebook Pages and Groups with Buffer's Facebook scheduling and analytics tools.
There’s a lot to learn about Facebook Insights. To make this guide easier to digest, I’ve broken the rest of this guide down into 11 bite-sized chapters — one for each of the 10 key tabs of Facebook Insights and a final chapter for the remaining tabs.
In each chapter, we’ll walk through the sections for each tab, explain how to use them, and share relevant tips for extracting more insights.
Let’s go!
To access Facebook Insights for your Facebook Page, head to your Facebook Page and click on “Insights”.
How to use Facebook AnalyticsThe Overview tab within Facebook Insights does more than it says. Apart from showing you key metrics of your Page (Page Summary), it also shows you the key metrics for your five most recent posts and a brief comparison of your Page with similar Facebook Pages.
Sections:
The Page Summary section shows you the key metrics of your Page for the last seven days, such as Page Likes, Post Engagement, and Reach. It also tells you the percentage change from the previous period and shows graphs for the period.
This section is great for getting a quick assessment of your Facebook Page performance.
For example, if you are focusing on growing your Page, you can quickly access your growth by looking at your Page Likes and Reach. If you are posting more videos to drive engagement, you can immediately see if your strategy is working by looking at your video views and post engagement.
This section shows you the key information of your latest five posts — published date and time, post caption, post type, targeting, reach, and engagement.
This section is great for getting a sense of how well your recent posts are performing and which type of posts are performing well recently. For example, you might notice that curated link posts outperformed other types of posts. Then, you could experiment with posting more link posts.
Pages to Watch is one of our favorite Facebook Page features. It gives you a quick comparison of your Page with a few other Pages you want to watch. If you click on any of the Pages, it’ll show you the top posts of that Page from the current week.
This section is great for seeing how your Facebook Page is performing among your peers and competitors. By looking at the top posts of those Pages, you can also stay in touch with what’s trending in your industry or curate great content for your Facebook fans.
Export your data (at Page Summary): If you want to analyze your Page data further, you can export metrics of your Page, posts, or videos as a CSV or Excel spreadsheet. Facebook provides a lot of data in the spreadsheet.
Click to see more insights (at Your 5 Most Recent Posts): Click on the post title to see the detailed breakdown of the performance of a post.
Discover what’s working (at Pages to Watch): If you click on any of the Pages, you will get a pop-up with the top posts of that Page — ranked from the most engaging to the least engaging.
The Likes tab lets you go beyond just knowing the number of Likes your Page has. It shows you the growth, averages, and sources of the Likes.
Sections:
This graph shows you the overall trend of your Page Likes. If the graph is showing a plateau or a downward trend, it’d be great to dig into it and understand the cause.
This graph informs you the daily growth of your Page Likes and breaks down the proportion of (organic or paid) Likes and Unlikes your Page receives. While it’s great to have positive net Likes, it’s helpful to monitor the Unlikes trend, too.
This graph tells you where your Page Likes came from, such as directly from your Page, from your ads, or Page suggestions that Facebook serves to users. For example, if you are running Facebook Page Likes ads, you should see the “Ads” portion increasing.
TipsSet your date range: At the top of the page, you can set the date range you are interested in. You can either drag the indicators on the graph, select “1W” (for 1 week), “1M” (for 1 month), or “1Q” (for 1 quarter), or set specified start and end dates.
Know your Like and Unlike sources: If you click or drag to select a date range on any of the graphs, it will show you the Like and Unlike Sources for that selected period.
Compare your averages: If you click on any of the metrics on the right of the graphs, you’ll get two averages for that metric — Your average for the last period and your average for the current period.
The Reach tab informs you about the reach of your Facebook Page and posts and the factors that increase or decrease your reach.
Sections:
This graph shows you the number of people your posts have reached (organically or through promotions). It can be a quick way to assess your organic reach over time and if your ads are working.
When a post receives engagement, Facebook will serve it to more people as the engagement on the post implies that people are interested in the post. More engagement, higher reach.
It seems like this chart will only appear if you have a high number of reactions to your Facebook posts. It’s a great way to judge the sentiments of your posts.
“Hide Posts”, “Hide All Posts”, “Report as Spam”, and “Unlike Page” are considered as negative feedback. They are ways users tell Facebook that they don’t want to see a Page’s posts. Facebook will accordingly show those posts to fewer people. As you’d want to keep these negative feedback low or zero, it’s great to monitor this graph.
Total reach is the number of people who saw any activity from your Page such as your posts, posts to your Page, ads, mentions, and check-ins. Just like post reach, it’s a great way to see how your organic and paid reach has been growing. For example, the graph above is our total reach for the past quarter, and it’s showing a promising increase.
Set your date range and compare your averages: Just like in the Likes tab, you can set your data range at the top of the page and compare the averages of each metric by clicking on the metric.
Understand your posts activity: If you see a spike of reach, engagement, or negative feedback, you can click or drag to select that section of the graph and find out more. Facebook will show you the active posts during that period, in decreasing impression order.
For example, there was a spike in our reach on February 22. When I click on February 22 on the graph, I learned that this post was taking off that day and our audience likes such a post.
See your reach breakdown: If you prefer numbers over visualization, you can click or drag to select a date range on the Total Reach graph to see your total, organic, and paid reach in a table format.
The Page Views tab is a little like the traffic report in Google Analytics. In here, you’ll learn about your page views and top traffic sources.
Sections:
Total views is the number of times people viewed your Page. If the same person visited your Page twice, it’ll be considered as two views.
Total people who viewed is the number of people who have viewed your Page. If the same person visited your Page twice, it’ll be considered only as one. This figure should be equal or less than your total views.
This graph shows the top five traffic sources that have directed people to your Page. Knowing this allows you to increase your efforts on those sources if you want to increase your page views.
TipsSet your date range: Just like in the Likes tab, you can set your data range at the top of the page.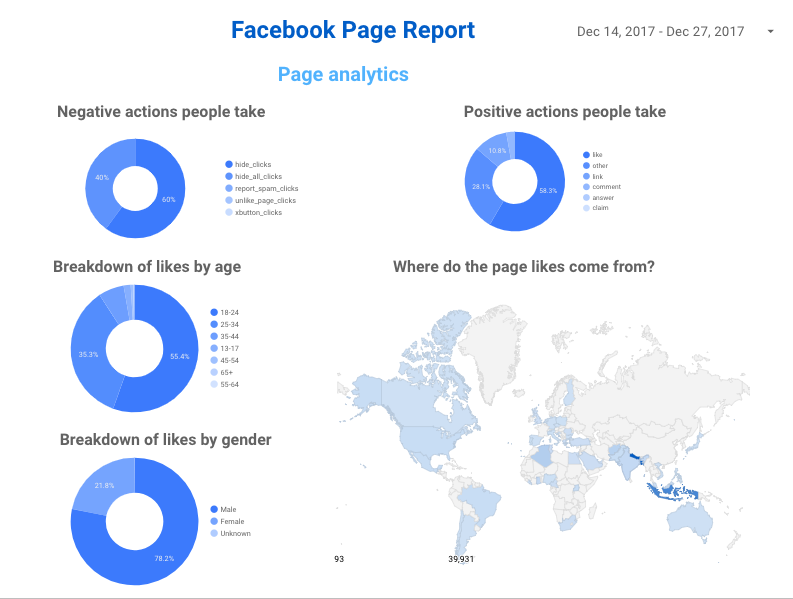
Breakdown the data: You can break the page views metrics down by certain characteristics. For total views, you can break it down by section (of your Facebook Page). For total people who viewed, you can break it down by section, age and gender, country, city, and device. This can help you understand more about the people who are interested in your Page.
The Actions on Page tab allows you to understand what people do when they are on your Page. The few actions that Facebook considered are clicking on “Get Directions”, clicking on your phone number, clicking on your website, and clicking on your action button.
Sections:
This graph shows you the number of actions people have taken on your Page.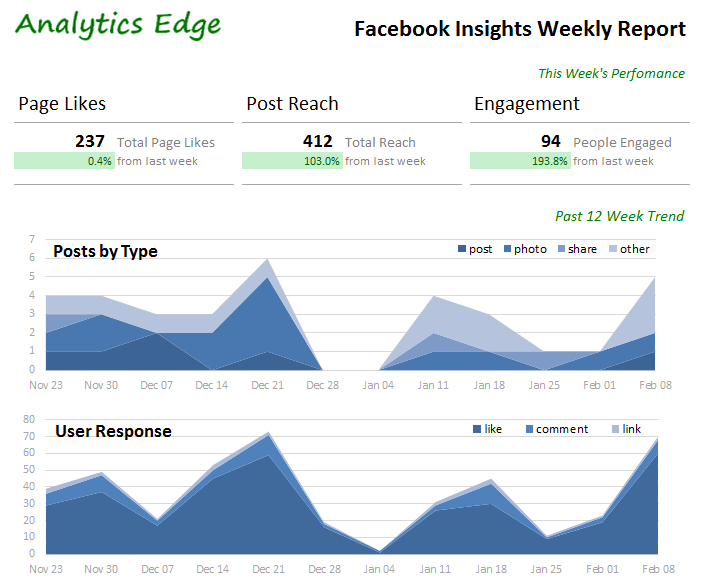 If you are a local business, you might be more concern about the number of times people want to get directions to your place or get your phone number. If you are an online business, you might be more concern about the number of website clicks. (Action button is the huge blue button on your Page.)
This graph and the subsequent graphs show you the number of people who took the respective actions on your Page.
Our action button says “Sign Up” and directs people who click on it to our homepage. From this graph, we can get a sense of the traffic our Page drove to our homepage. (We also use UTM for the link for additional tracking.)
TipsSet your date range: Similar to the few tabs before, you can set your data range at the top of the page.
Breakdown the data: Just like your page views graphs, you can break the actions taken graphs down by certain characteristics.
The Posts tab contains all the information about your posts such as reach and engagement. You can also boost your posts from this tab directly.
Sections:
We believe that there isn’t a universal best time to post on Facebook, but there’s the best time for your brand to post on Facebook. This section can help you with that. It shows you how active your Facebook fans are, on average, on each day or the week and each hour of the day.
You can hover over each day to see an overlay of the activity on that particular day vs the averages.
This section tells you how each type of posts (e.g. link, photo, or video) fare in terms of average reach and average engagement.
From here, you can tell which type of posts does best on your Page, and you can adjust your posting strategy accordingly. For example, if you find that videos have the highest average reach and engagement, you could experiment with posting more videos.
This section is quite similar to the Pages to Watch section in the Overview tab. While the one in the Overview tab shows you the overall performance of those Pages, this section shows you the top post of the week from each of those Pages and the engagement it received.
This section lists all the posts you have published on your Page and the relevant information — published date and time, post caption, post type, targeting, reach, and engagement.
TipsSort your posts: You can sort your posts by published date, reach, or engagement (post clicks or reactions) by clicking on the title of the column.
View different metrics: You can view different metrics for reach and engagement. For reach, you can choose:
For engagement, you can choose:
 Events:
If you often organize Facebook events, the Events tab will enable you to be more data-driven by providing you with key data of your events. You can find out what’s working and what’s not working with your event promotion. You get data such as the number of people who saw your event, the number of people who responded to your event, and the demographics of your audience.
Sections:
In this section, you have several graphs about the awareness and engagement of your all events. These are the data available:
Awareness:
Engagement:
Tickets:
(For the data of specific events, see the tip below.)
Apart from awareness and engagement, you can also get a breakdown of your audience by age group and gender. This can inform you about the type of people who are most interested in your events.
The second half of the page shows you the insights of your upcoming and past events. You can toggle between upcoming and past using the drop-down menu in the upper-left corner.
TipsClick to see more insights: If you click on an event title, a pop-up will appear, with the data of that particular event. As it shows data up to the last 28 days only, you might want to record them down after the event.
The Videos tab tells you how well videos are performing on your Page. It mainly tells you the number of video views, broken down into:
Sections:
This graph shows you the number of times your videos were viewed. Facebook consider 3 seconds or more as a video view.
This graph shows you the number of times your videos were viewed for 10 seconds or more. If your video is less than 10 seconds, Facebook counts a 10-second view when people watch 97 percent of it.
While this number tends to be lower than video views (i.e. the 3-second views), I think it is more indicative of the number of engaged views.
This section shows you the top five videos which have been viewed for three seconds or more, the most. It can give you a quick idea of the kind of videos that perform well among your fans.
TipsView different breakdowns: In the upper-right corner of each graph, there is a drop-down menu where you can choose between different breakdowns.
Compare your averages: If you click on any of the metrics on the right of the graphs, you’ll get two averages for that metric — Your average for the last period and your average for the current period.
Click to see more insights: Clicking on a video title will bring up a pop-up with the deeper insights of that video. You can click on any of the stats and see even more insights.
The People tab is a simple overview of the people who liked your Page, saw your posts, or engaged with your Page or posts.
Sections:
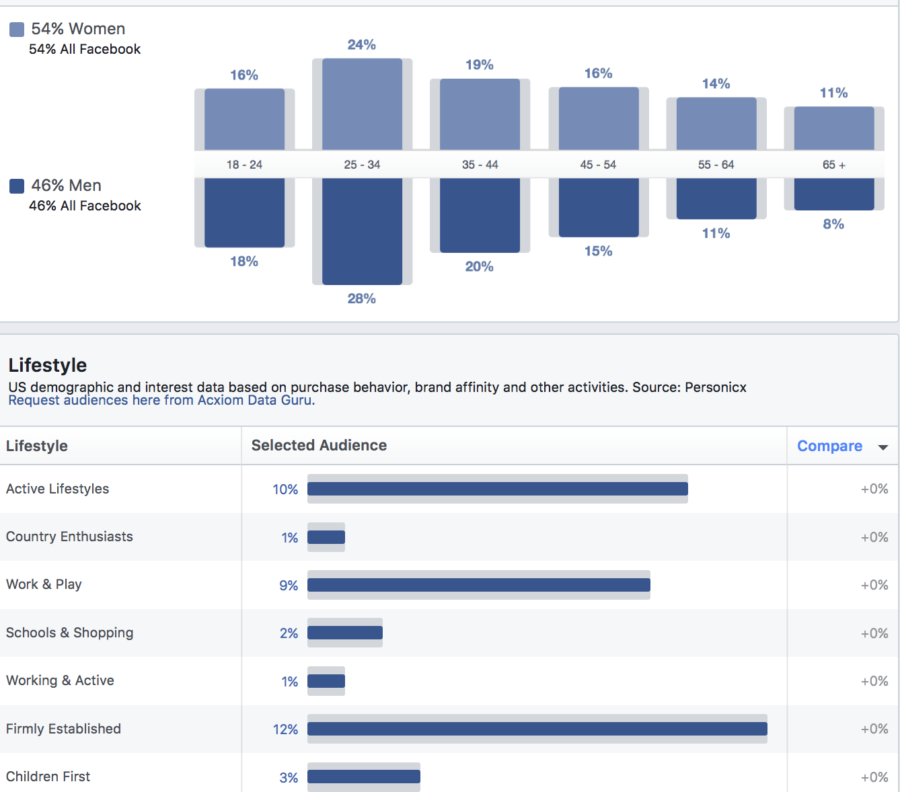
Your fans are people who liked your Page. This section breaks down your fans by age group, gender, location, and language. From here, you can tell which demographic are most interested in your Page.
People reached are the people who saw your posts in the past 28 days while people engaged are the people who liked, commented on, or shared any of your posts or engaged with your Page (e.g. messaged) in the past 28 days.
What’s interesting is that people who saw or engaged with your posts are not necessarily only your fans. This creates the differences in percentages. For example, while 41 percent of our fans are women, 55 percent of people engaged are women. This could imply that our posts tend to be more interesting to women than men.
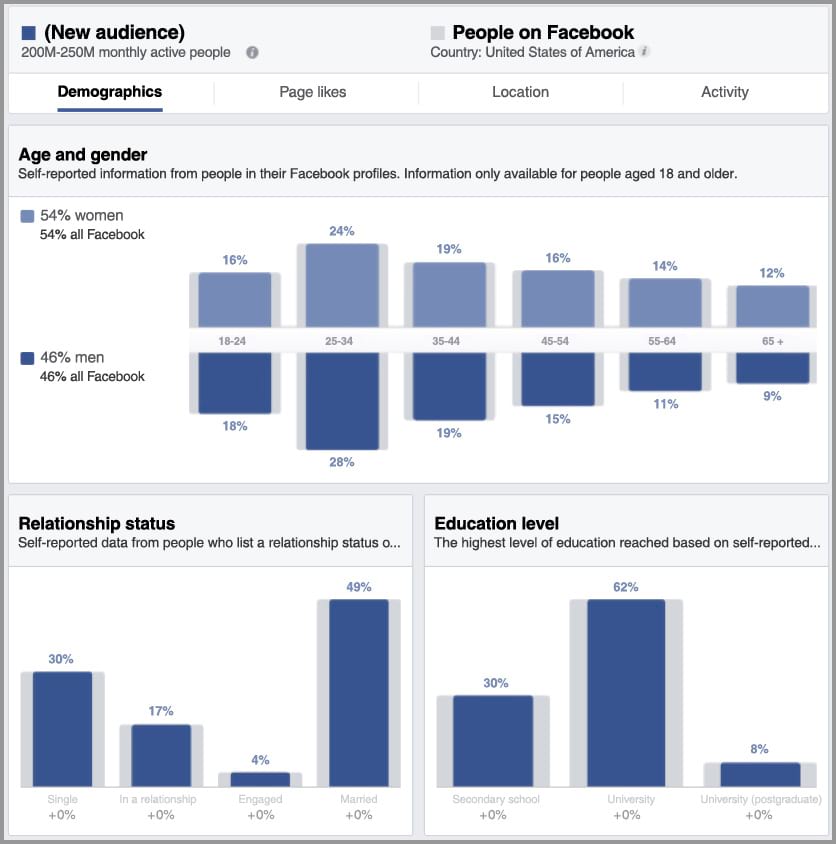
Learn more with Audience Insights: Audience Insights, a tool within Facebook Ads Manager, is much more powerful than the People tab for understanding your fans. While it does not show you information about people who saw or engaged with your posts, it shows much more information about your fans.
Besides demographics information, you can discover data such as other Pages that your fans like. (You can use this information to set your Pages to Watch!)
To access Audience Insights, head to Facebook Ads Manager and select “Audience Insights” from the drop-down menu in the upper-left corner. Alternatively, you can visit this direct link: https://www.facebook.com/ads/audience-insights/
Once there, select “People connected to your Page” and the Page you are interested in.
The U.S. is selected as the location by default. You can deselect it if you wish to look at your audience worldwide, however, Household and Purchase information are currently only available for the audience in the U.S.
The Messages tab shows you the performance metrics of your conversations with people on Messenger.
Here’s what each of the metrics means:
Total conversations is the number of conversations between your Page and people on Messenger.
Your Responsiveness is the percentage of messages you’ve answered and your average response time.
Deleted Conversations is the number of conversations with your Page that people deleted.
Marked as Spam is the percentage and number of conversations from your Page that were marked as spam.
Blocked Conversations is the percentage and number of conversations from your Page that have been blocked.
See up to 180 days: For messages, you can see the stats for up to the past 180 days. You can select a timeframe by clicking on “Last 7 days”.
The remaining tabs might not be as relevant to most people as those above or they might not even appear for you. I’ll briefly go through each of them in case you are curious about them.
The Promotions tab gives you a quick overview of your recent promotions. It’s a great place for you to check your recent promotions while you are in your Facebook Insights. Alternatively, you can use the Facebook Ads Manager, which might be more comprehensive.
When you get mentions from a Verified Page (a Facebook Page with a blue tick), the Branded Content tab will appear among the list of tabs and the posts will show up there.
You’ll be able to see the reach and engagement stats, just like your own posts. You can even share and promote these posts.
If you run a local business Page, you’ll have a Local tab. In this tab, you have information about the foot traffic in your area, demographic information about people near your place, and percentage of people nearby who saw your Facebook ads. (Mind-blowing!)
It’s so awesome that Facebook provides such a comprehensive analytics tool for free! From reach to posts, to events, to fans, Facebook Insights provide a wealth of data and analyses about your Facebook Page.
Is there a part of Facebook Insights that you love the most?
How do you use it for your business?
Do you use any other Facebook analytics tools?
I’d love to learn from you. Thanks!
Brought to you by
Get started for free now
Facebook has powerful tools to analyze your audience in detail and find a similar one. Working with such an audience will give a good conversion. Here are three ways to find and analyze audiences on Facebook that you might not know about.
The English (US) version of Facebook has a lot more options for searching and working than in Russian. Graphsearch is a detailed search from Facebook, which is also indispensable for analytics.
Go to "Settings", section "Languages" and select English (US) from the list.
Now create a query in the search line. Smart search only works with English, but it understands community names in Russian.
You can search for public pages, people, events, posts. There are different options for searching. Look at the examples:
People who like people who like Page title
Find people who liked the page you enter.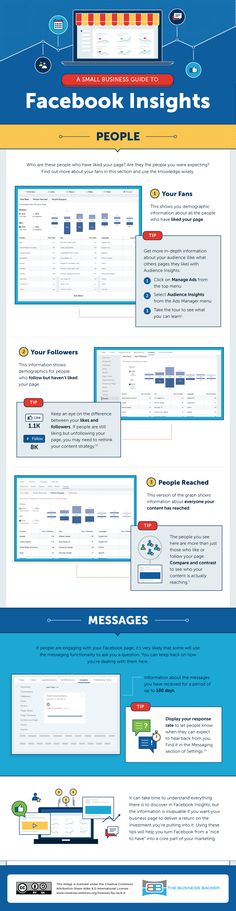 Important: enter the name in the search exactly the same as it is indicated on the page.
Add other options:
People who are not my friends and like Page title and live in Moscow, Russia
People you don't have as friends who "Like" the page and live in Moscow.
Know your audience:
Interests liked by people who like Page title
Interests of people who "Like" the page.
Pages liked by people who like Page title
What other pages your audience is following.
You can also add different parameters to such requests: place of residence, gender, age:
Pages liked by women who who are older than 25 and younger than 30 and like Page title
Graph Search can search posts from a specific person for a certain period:
Posts of Name from September 2017
This is not all the features of the built-in analytics in Facebook.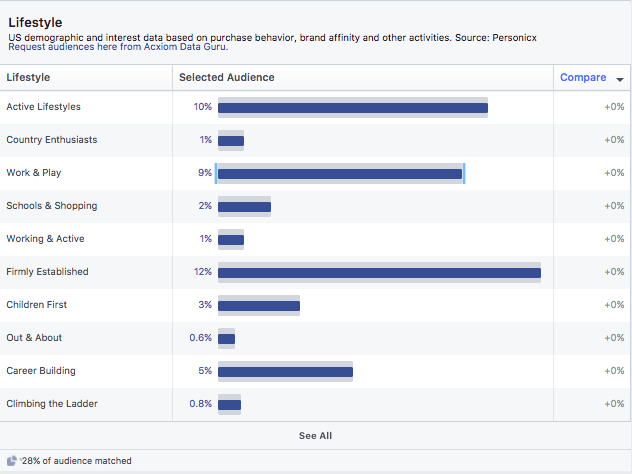
Photos and videos taken at a specific location or dates of interest:
Photos taken in Moscow, Russia from May 2017
And find information about person that is not listed on his page. True, if he did not disable this feature in the settings:
Interests liked by Name
Pages liked by Name
Use different options and create your own queries. If you find it difficult to formulate requests in English, try a special service. http://graph.tips
Use Popsters to find the most popular posts and understand what content works best. The service works with all public pages and groups. Thanks to this, you can compare different pages with each other: for example, to evaluate the activity of competitors or to select profiles for advertising.
The tool finds the posts with the most Likes, Views, Shares, Er.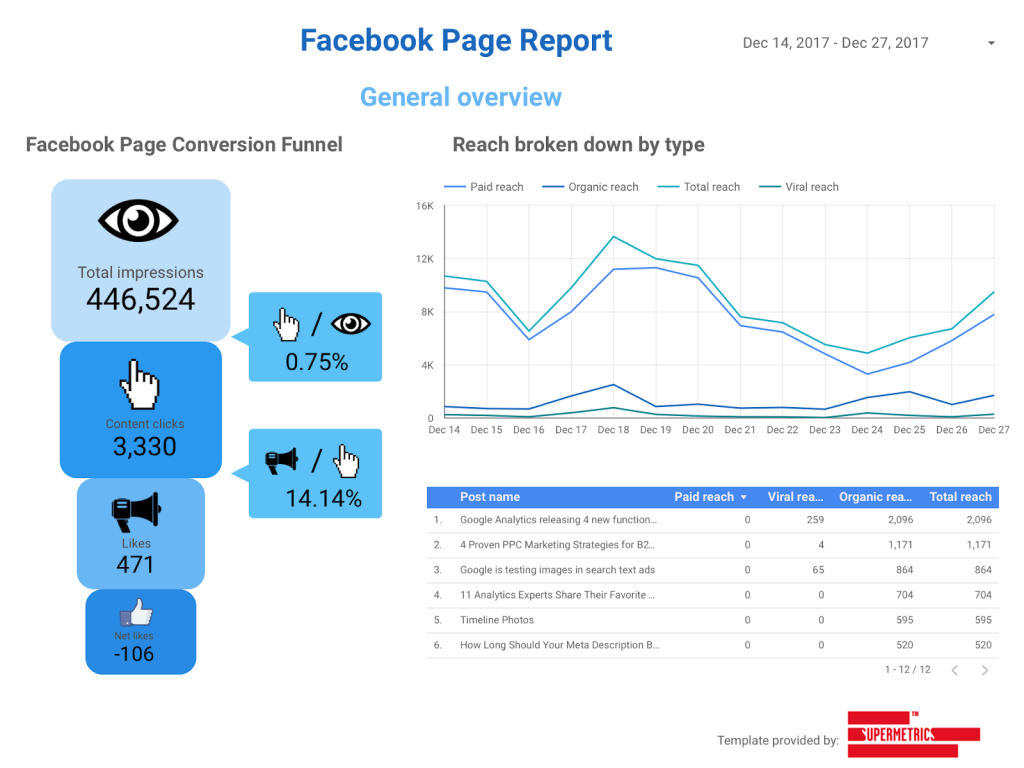 You can also filter by content type.
In Popsters.ru you can find out and evaluate the most successful days of the week and time of day for publication. Also understand what type of content engages the target audience more.
And in Popsters you can create a report in a couple of clicks and upload statistics and analytics data to Facebook.
A free Facebook audience analytics and analytics tool that reveals the demographics, interests, and behaviors of your potential customers.
Go to the section at the link: https://www.facebook.com/ads/audience_insights (Or go to the "Audiences" - "Audience Statistics" section in AdsManager).
To start analysis on Facebook, click "Create an audience" and choose from three options:
All Facebook users
Users associated with your page
Custom audience
In the left column, set up the audience that you will analyze: your page subscribers ("Users connected to PAGE") or the audience you are interested in. The settings are the same as in the advertising account when setting up targeting: gender, age, geography, interests, user behavior, page links.
This Facebook analytics data is divided into 4 groups (for the analysis of the US audience - 6, including sections "Family" and "Purchase"):
Demographic data: age, gender, marital status, level of education, position.
Page Likes: popular target audience page categories and Facebook pages that these people follow.
Location: cities, countries and languages of the audience you are analyzing.
Actions: frequency of actions (how often the audience subscribes to pages, comments on posts, likes and reposts publications) and devices used to visit Facebook.
After analysis, the created audience can be saved, and then set up ads for it.
Facebook will find potential customers for you. To do this, he needs to know who your customers (or readers) are.
To do this, put a Facebook pixel on the site or select a page (you must be its administrator) whose subscribers the new audience should look like.
Set the required parameters. To select the audience of the highest quality, select the appropriate source: for example, people who are active on your page or made a purchase on the site. This data is taken based on Facebook's internal algorithms and statistics.
Use the slider to adjust the degree of similarity of the people found to the audience from the source: with a value of 1, the similarity will be maximum, but the base will be smaller, with a value of 10, vice versa.
A lookalike audience is created for several hours (up to 24), and then automatically updated every 3-7 days.
Useful articles on a related topic:
The success of an advertising campaign depends on a combination of factors. To determine whether it is going according to plan and, if necessary, make adjustments to the strategy, you need to understand how each marketing tool affects certain KPIs. In this article, we will walk you through where and how to view mask statistics on Instagram and Facebook. After the instructions, we will come to the most important thing - we will share tips for increasing views, discoveries, saves and increasing audience coverage.
Article navigation:
We go to Spark AR Hub and act step by step:
 By default, statistics for the last 28 days are opened to us. But you can set other parameters: "Last 7 days" or "All time".
 Let's analyze the fourth step in detail. In the dashboard that opens, two tabs are available to us: “Engagement” and “Audience”.
We see the same data on it. They can be filtered by the time intervals "Last 7 days", "Last 28 days" and "Last time". We click on one of the indicators, and a graph opens where you can see how the figure changed by day.
Now let's focus on two KPIs - "Impressions" and "Publications". Their charts have three types of breakdowns:
Available for "Impressions" in traffic sources are Instagram Stories, Posts and Reels, and Facebook Stories and Posts.
For "Publications" in traffic sources, available: Direct messages, Stories (including for close friends), Instagram posts and Reels, as well as Facebook Stories and Posts.
For the rest of the metrics – Discoveries, Capture Uses, Saves – only breakdowns by day and platform are available.
Here we have access to the percentage of people by gender, age and country in which the effect was used. We can view statistics for different platforms separately from each other. In the column "Custom option" displays accounts in which the gender is not specified.
To the right of the graph, by default, are rounded numbers. To find out the exact number of people in a particular category, you need to hover over the desired graph.
The success of a filter is determined not only by the available indicators, but also by their conversion. It works as an additional criterion, which is indispensable when working with a tool. It is important to calculate exactly it and evaluate the marketing tool in this plane. To do this, first you need to figure out what each number on the dashboard means:
 On the left are those that a person saved intentionally. So in the "Saves" on the dashboard, only those on the left are counted.
 The best way to evaluate the AR effect is through the conversion funnel. We build it like this:
Saves are excluded from the general list, because they do not directly affect changes to other data. The number of saves demonstrates how much the audience liked the effect and how much it is in use - its "everyday".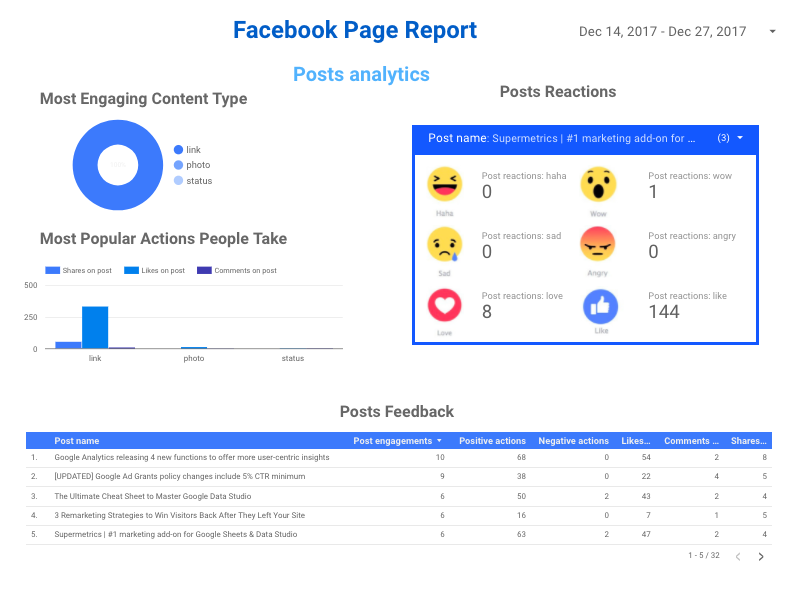
The number of impressions is the most influential part of the funnel. Together with them, all other components of it grow. Of course, the funnel can be narrow. But even under this condition, the above regularity works.
There is a strong relationship between impressions and publications: the more one, the more the other.
On average, if an effect gains 250,000 impressions in 6 months without additional investment in advertising, then it can be considered successful. This mark can be achieved if three conditions are met: the AR tool is interesting to the audience of the account, there are reminders of it in the content, and it has begun to spread organically, but not virally.
Even before the start of the project, you must answer the main question: how will users find your filter? If you just post it and talk about it once, then it will never go viral. The same rule applies here as for any social media marketing tool: the effect must be promoted as part of a comprehensive strategy, and impressions must come from different sources.