This article is all about data.
We are all aware that Instagram stories in a very short time have acquired the attention of every marketer in the world and managed to take over the stories go to the platform from Snapchat and TikTok.
According to the latest Instagram updates the platform is evolving beyond the square photo format, and it’s placing a huge bet on the Instagram video formats. Users on both iPhone iOs and Android are able to use innovative features to make boomerangs, hands-free selfies, repost or just view stories of their favorite influencers. All these activities, contribute to the high adoption of the story format.
In this relation, we have interesting stats to prove why this social media format has taken such an important place in almost every marketing strategy.
Here you will find useful statistics and insights, starting from general data about the overall usage of Instagram stories, to real case studies that give evidence about the performance of the Instagram story ads.
Related to this, here are the main topics in this article:
What’s inside:
show
Instagram story is the vertical photo or video on an Instagram account that is short (up to 15 seconds) that disappear after 24 hours.
Insta stories are showed differently and separately from your Instagram feed or Reels.
Now let’s see how an Instagram Story looks like and what are its elements.
First of all, the body of the Story is the picture or the video that represents the ephemeral content.
In the top left corner is always the profile photo and the username of the Story owner. Previously, if it was a verified account (like a business account or famous influencer), next to the username a verification icon was standing, but that’s not the case anymore. So, all the stories in this part look the same.
On the top right corner, there are three dots that yellow you to report the story, copy the story link, share it, or mute the stories from that user.
At the bottom left there is a reply bar that you can tap to send a direct message from the Story. And right next to it there is a share arrow. If you want to share the story in a private message with another user, just tap the arrow, choose the Instagram user you want to send the story to, and click ‘Sеnd’.
A really cool option is the Story Reactions. If you swipe up the bottom of the screen a few emojis will pop up. You can choose one and tap on it to let know the Story owner how you feel about their Story without typing anything.
Lately, Instagram is pushing a new feature called Link Sticker that is available in the stories stickers library and is the new solution for adding links on the Instagram story.
Since Insta Stories are becoming as popular as Instagram posts, as a business, you should consider including them in your social media marketing strategy.
IG stories are a cool feature that allows Instagram users to share a temporary story with their followers, in a highly immerse format.
To create an IG Story tap on your profile picture in the top left corner at the top of your screen. You can take photos and videos directly from the app (by tapping the camera icon) or you can upload them from your camera roll.
After you decide on your story, you can adjust it in any way you like. For example, you can take a boomerang video, insert a selfie as an image overlay, display it on full-screen, or resize the creative. Just swipe left of the screen to view more layout options.
To make the story more engaging and appealing there are many decorations and functionalities you can add to your story, like stickers, gifs (giphy), hashtags, emojis, use different fonts, question stickers, hashtag stickers, poll stickers, add links, and you can also tag people.
Also, there’s another cool feature called Instagram Story Highlights that allows you to keep your favorite stories on your account for more than 24 hours. Highlights are permanently on your profile and can be updated at any time.
Well, Snapchat was the first social media platform that implemented this feature. But no matter if you’ve ever used that app or not, Instagram stories are very easy to view.
IG stories use the same interface on both iOs and Android, so it doesn’t matter if you use iPhone or any other smartphone.
Just open your Instagram app and on the top of the screen, you’ll see a series of mini profile pictures highlighted in circles. Those are the stories actually. Tap the first one (or anyone you want to view) and that’s it.
If you want to view all photos and videos within the same Story, just tap on the screen and they will change.
And if you want to go from one Story to another just swipe right and you’ll see the next user’s Story.
Note: If you don’t do any action on the screen while watching stories, they will automatically swipe from one to another photo/video within the same story. And right after that, the next user’s story will be opened. So, you can view stories hands-free. Cool, right?
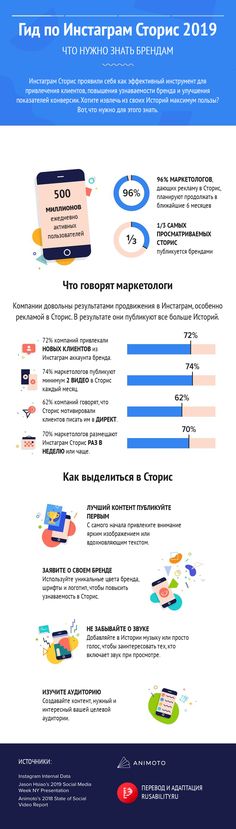
These are official statistics published by the Instagram team about the vast usage and adoption of Instagram stories not just from regular users, but also by Instagram businesses from all over the world.
We’ve outlined these 5 data points to understand the power of Instagram stories and why this format is gaining so much traction.
So, here are the main stats showing how many people use Instagram stories and how popular this format is:
And if this format is compared to the current, most popular format such as Facebook and the Instagram feed, there is a viable prediction that sharing with Instagram stories will surpass sharing through Feed views.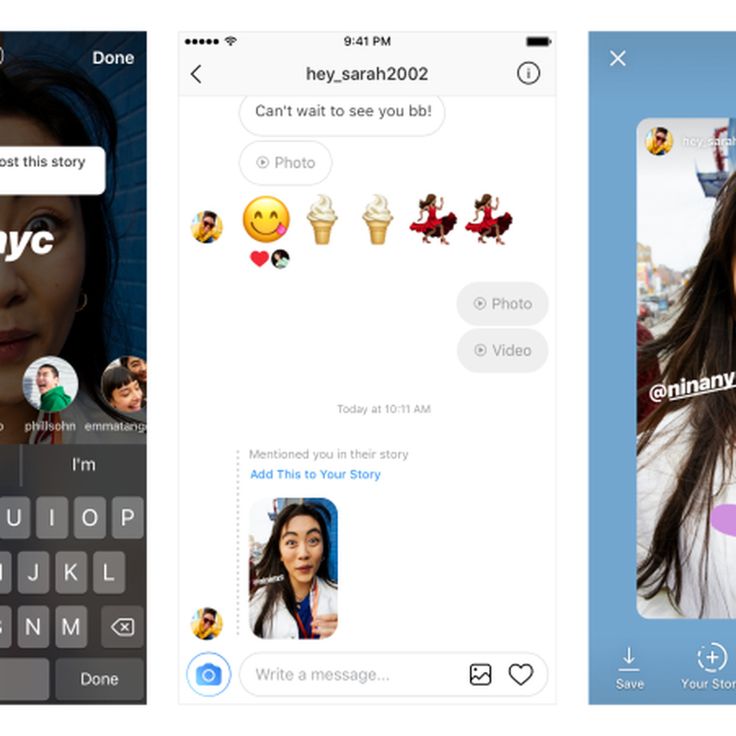
Huge, right?
Other tech giants are also following the trends with the recent launches of LinkedIn Stories and Google Stories.
Well, let’s see if this strong number can really impact your usage of the stories and if you can get some of the results that this format is promising.
In the previous section, we’ve seen that Instagram stories are generally enduring format. But in order to see this for ourselves, we need to start monitoring Instagram insights for our own stories.
Similar to the analytics section for your account and Instagram posts, your Stories insights can be found in the top right corner of your Instagram business profile, by tapping the “Insights” button.
If you still have not seen the Insights section in your Instagram account, here are the steps on how to access them.
Please note: before you start looking for the Insights section, make sure your Instagram profile is converted to a business profile by connecting your Instagram account with your official Facebook business page. Once you do this you will get the Insights option in your Instagram profile.
There are a few ways how you can view your stories’ statistics, depending on if you want to view the insights for the current/live story or you want to check historical data about the previous stories.
To access the Instagram stories of the active story, follow these steps:
If you want to access the insights for Instagram Highlights, the above steps are the same.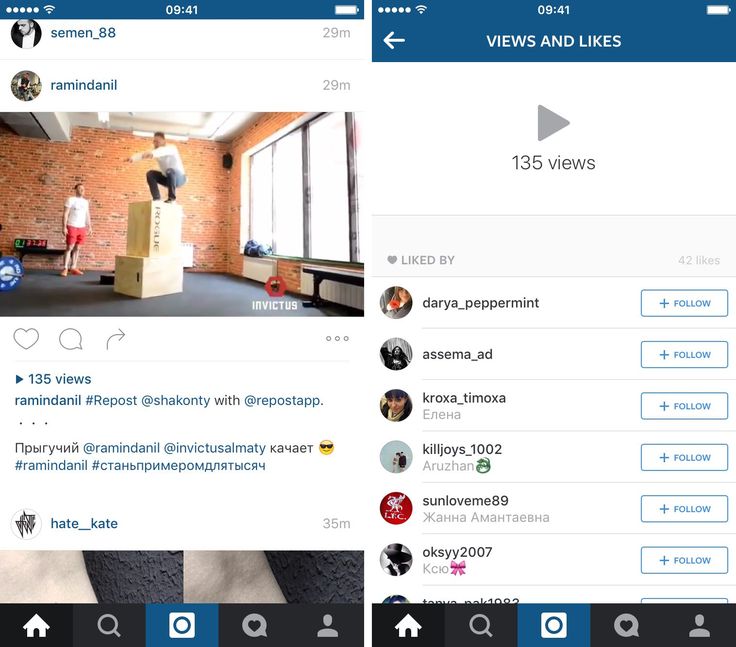 Just go to your profile and tap on a Highlight, swipe up, and tap the chart icon explained before.
To view Instagram stories analytics and insights for all your previous stories, follow these steps:
Next, you can see how to access the historical data about all your stories.
Just follow these steps:
In this section, you are able to view insights for each particular story. You will notice that in the layout the stories are organized based on the slides and a metric is displayed in the bottom middle.
Each metric can be changed by clicking on the top metric blue word that is selected at the moment. Here is how to do this.
Once you access your Instagram stories insights, you will see some specific data items that are very unique to the story format.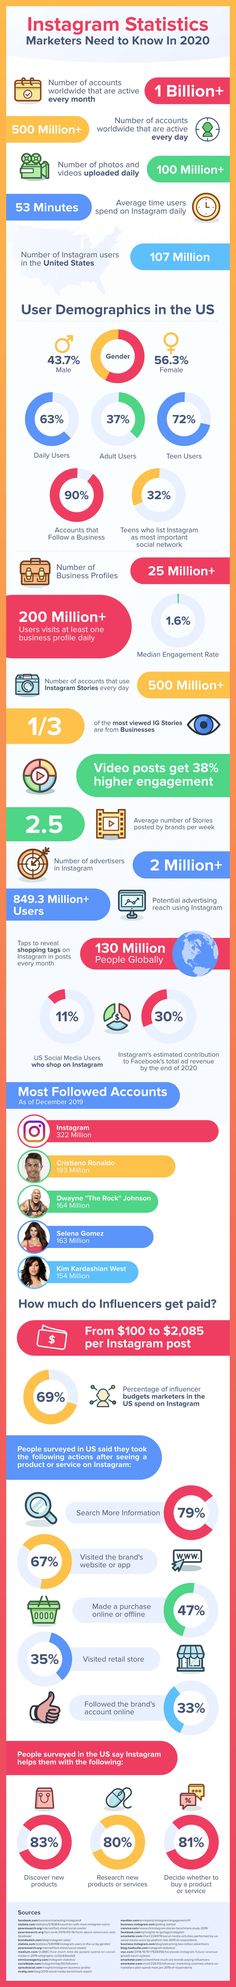 In order to understand their meaning and how Instagram measure them, please check the official Instagram stories insights definition for the most common metrics:
In the preview of the story insights, you will also see a section with Interactions, that might include the following data points: Replies, Website clicks, and Profile visits.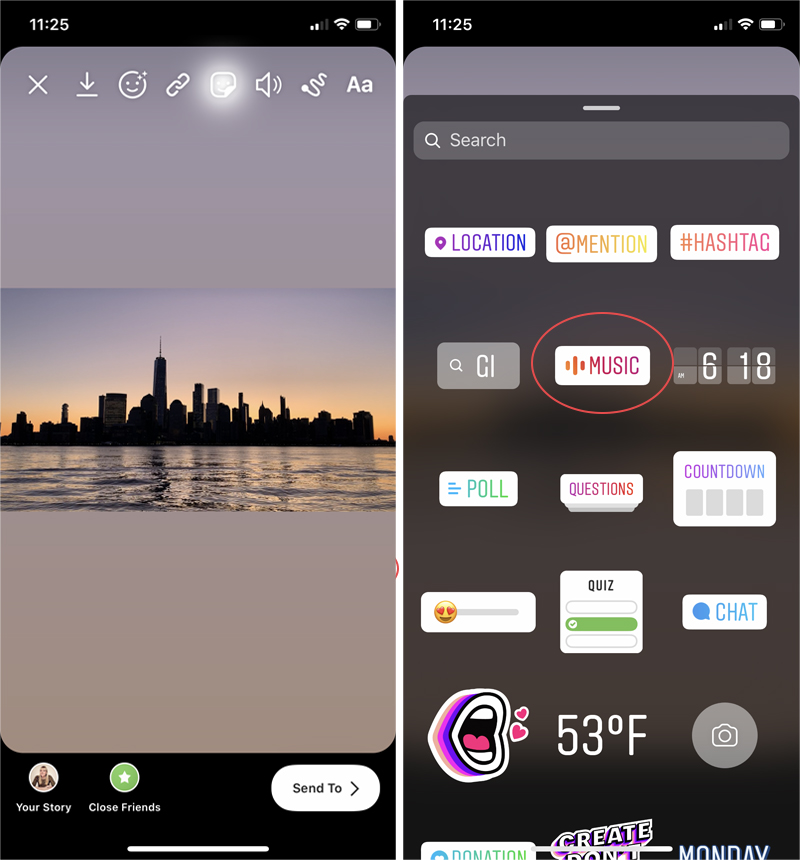
Another one worth mentioning here is the Sticker Taps, which shows the number of times people have tapped on a hashtag, location tag, mention, or product sticker on your Story.
It is good to know that Instagram shows this data from the moment you’ve converted your personal to a business account. So for any previous stories, you will not able to view their insights.
New Instagram stories metricsInstagram is rolling our constantly new features and related metrics.
Some of the newest metrics are Directions, Calls, Texts, Emails – which are related to the effect that Instagram stories had on the action performed on your profile CTA buttons.
In the following text, we will show you a few tips on how to analyze the metrics of your Instagram stories and will answer some common questions that you might have about the stories’ data you will see in your account.
Why impressions and reach are different metrics?The difference comes from the fact that a single person can view your story multiple times. So if they view the story 5 times you will get 5 more impressions.
And when it comes to the reach metric, it represents the number of unique people who viewed the story, regarding the number of times they viewed the story.
What is better, taps back or taps forward?In short, taps backward. Why? Well if people tap more backward that can signal that they have viewed more of your story and that is interesting, so they go back and spend more time on the story.
Taps forward can signal that maybe some parts of the story slide are boring or not giving enough information so people want to jump straight to the end in order to get the idea of the story.
But please note that on the slides where you have arrows or explicit call to action to navigate further, the taps forward can be increasingly high if compared with other slides. So that will be an expected result of the action you want the story slide to achieve.
How Exits are calculated?By definition, exits occur when a person leaves your story.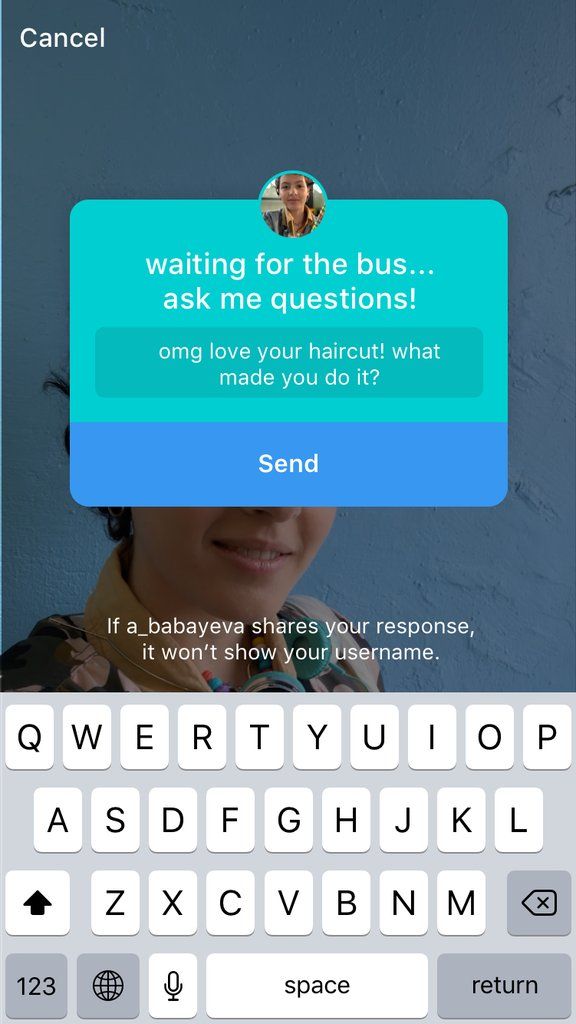 This does not mean that they went back or tapped forward. This means that they:
So the conclusion is that your primer goal of the story is to have a lower percentage of the exits when compared with the reach.
How to measure clicks and CTRs to my website?To measure click-through rates or the number of clicks coming from the stories to your website, you can include a UTM type of link for your ‘See more’ button.
In order to measure the Instagram stories’ performance more precisely, you can track the number of clicks coming to your website in Google Analytics.
In many cases, this See more button is still not available, so if you do not have this option you can try adding @ mention to lead directly to your profile, where you can add the UTM link in the bio section.
If you ever had the chance to analyze the success of your organic Instagram stories, you will come to the conclusion that the current Insights section described above is created for smaller users or business accounts who probably do not need to programmatically analyze the success of their stories.
But, if you want to have a professional approach in the stories insights analysis, you will need a third-party tool or software that will help you do more with your stories data.
The Instagram story viewer platform, EmbedStories tackles this issue and addresses the problem through a variety of functionalities that can help to analyze stories’ data at a larger scale.
Here are a few features that EmbedStories provides:
Here is a screenshot in a comparison mode for the insights of the generated stories in the EmbedStories system:
Regarding the Instagram analytics of the stories embedded on your website, here is a sample view of the report about the performance of a story beyond Instagram:
For more details about Insta stories analytics in EmbedStories, check the analytics tutorials.
When it comes to using the Stories format to create and boost sponsored ads, the results that most of the companies are getting are pretty awesome.
It seems that this vertical, mobile format is responding more to the user’s behavior, so having a native ad that can engage with them on a full screen makes total sense to drive great results.
We’ve analyzed few success stories that are published by Instagram on their official business page, and based on this survey, we’ve come to the following common statistics that can be expected if you run Instagram stories ads:
Additionally, one important metric that marketers usually define for their Instagram marketing objectives is to increase website clicks is the Link Clicks metric.:max_bytes(150000):strip_icc()/who-viewed-my-instagram-4580189-3-5c0ac8d5c9e77c00014dcb28.jpg)
This comes from the common practice to create Instagram story ads just to get the CTA option that allows you to add a custom link in the story. This is the main use case for Instagram accounts that still do not have the option to add links to their organic stories.
Here are other Instagram Story Ads metrics you will need to monitor:
To access the insights of the Instagram story ads you will need to go to your Facebook Ads Manager account and view the Chart data for the Instagram story ad. The main report that you will need to monitor looks like the sample below:
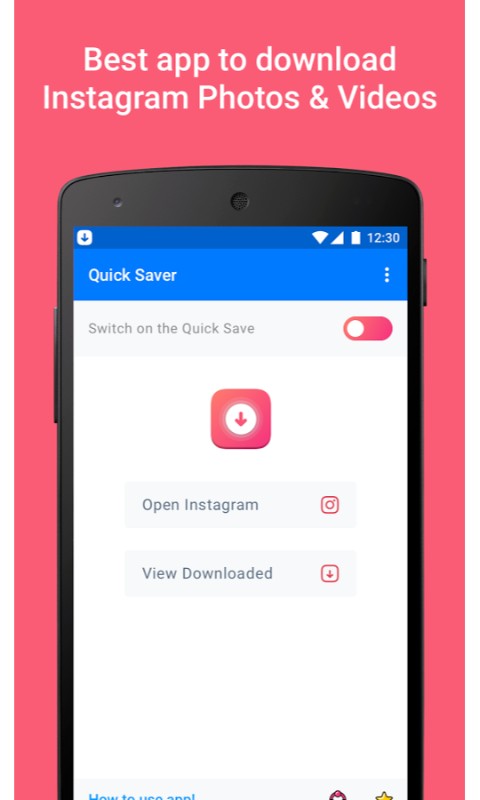
As we all know, Instagram Stories is a great way to share the little moments in life with your followers. And now you don’t have to invest thousands of dollars in design firms or software just for this purpose- there are plenty of free tools available for your Instagram content to bring you a number of views and engagement.
Here’s a list of the tools you should consider to boost the performance of Insta stories:
1. Stories IG maker – Canva is a popular tool when it comes to creating high-quality social media content, especially Instagram posts and stories. There are many templates you can use and with their easy drag-and-drop editor you can go beyond creativity. You can add stickers, imagery, and anything that may amaze Instagram users.
2. Instagram stories animator – You can use Boomerang to create unexpected Instagram videos for your stories. Instagram itself has this animation, but this tool offers you to create videos in a more creative way and not only for your Insta stories and Reels, but also for stories on other platforms as Snapchat, TikTok, or even WhatsApp.
3. Instagram stories scheduler – Well, not always you’ll have the time to post stories manually on your profile page.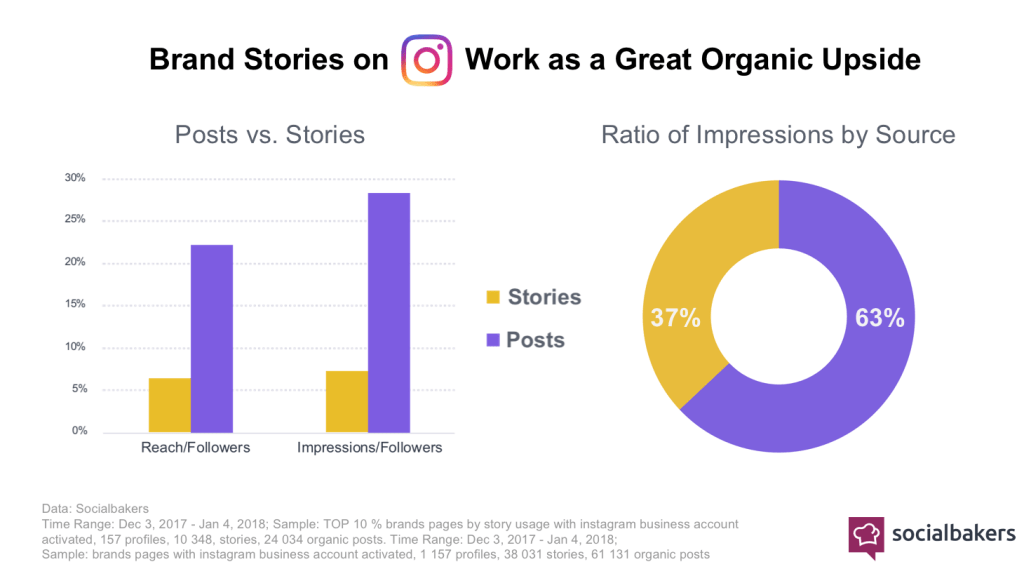 Buffer is a great tool that helps you schedule your stories in advance and punctually publish them on your Instagram profile. It’s a very popular tool between influencers, businesses, and creators.
4. Insta stories generator – EmbedStories is the right tool if you want to expand the reach of your stories beyond Instagram. It allows you to create a widget of your Insta stories and display them on your website. It integrates with the Instagram algorithm which allows you to bring your Instagram account to your website. Moreover, you can also mimic story highlights. Now, your subscribers can watch Instagram stories on your website!
5. Insta hashtag generator – What’s an Instagram app without hashtags? Hashtag For Likes is the tool that will help you enlarge that Instagram viewers list. Depending on your Instagram marketing goal, this generator will bring up easy, medium, and hard hashtags in chronological order. Whatever ones you choose to use it’s up to you.
6. Instagram story viewer – Stories disappear in 24 hours, but you can still archive them so your followers can still view Instagram stories later on. You can use the native Instagram options to archive and download Instagram stories, but you can level up and save the best stories in a web-based app as EmbedStories.
Instagram stories are the most native format that has proven to provide great results for digital marketers, and many businesses already are incorporating them as a vital part of their content strategy.
By understanding the Instagram algorithm and with the right content and constant improvement in the visual designs by using gifs, video, or various story templates, you can achieve great results. We’ve seen that there are lots of unique metrics for this format, that need to be monitored and analyzed in order to improve every future campaign that will include both organic or sponsored Instagram stories.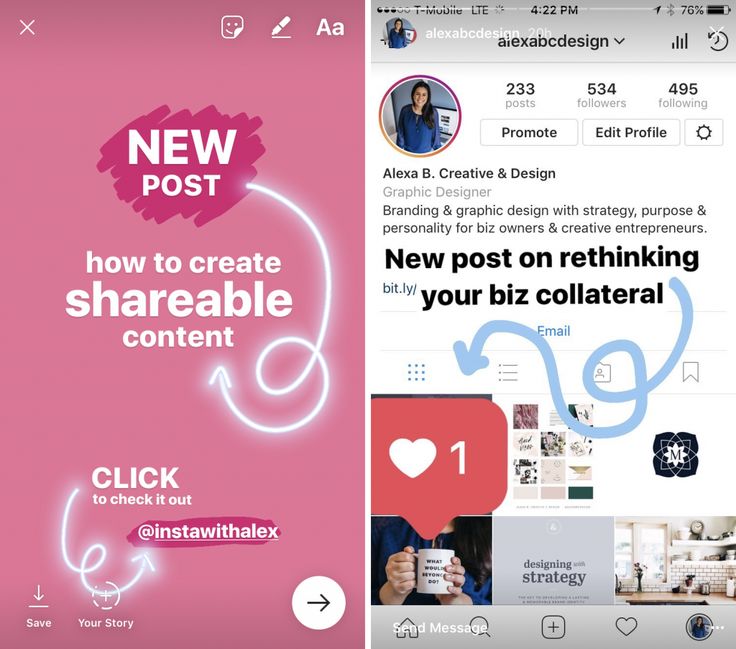
Stories disappear after 24 hours. But with a solid understanding of Instagram Story analytics, you can ensure they have lasting impact.
With top of the feed placement, links, and interactive stickers, Instagram Stories are a prime channel for brands to drive awareness, traffic, sales, and engagement.
Learn how to measure Instagram Stories analytics and which metrics to track so you can optimize Stories to achieve your goals.
How to view Instagram Story analytics
Understanding Instagram Story metrics you should track (and what they mean)
More things you can measure with Instagram Stories analytics
How to optimize your strategy based on your Instagram Stories analytics
Download your free pack of 72 customizable Instagram Stories templates now. Save time and look professional while promoting your brand in style.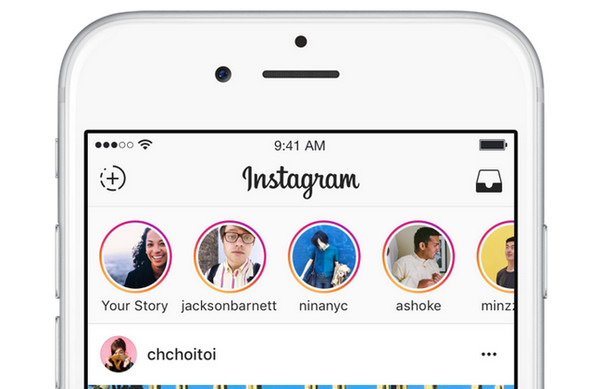
There are a few ways to check analytics for Instagram Stories. We break them down below. But first, make sure you have an Instagram Business or Creator account. Without one, you won’t have access to analytics.
How to view Instagram Story analytics in Instagram InsightsHere, you will see all of the stories you’ve recently posted. The default time frame is Last 7 Days. Tap on it, to adjust the time period. You can choose from several options, ranging from Yesterday to Last 2 Years.
Then, tap the dropdown menu in the top left corner of the screen to select the metric you would like to access.
Available Instagram Stories metrics include:
Once you select your time period and metric, you can scroll all Stories to see how many interactions each individual Story collected.
You can also tap on any Story and swipe up to view its detailed analytics.
To see the results of a poll or other sticker actions, click the eye icon beside the insights icon (it looks like a bar chart).
How to view Instagram Story analytics in HootsuiteTo view Instagram Story analytics in Hootsuite, add the Panoramiq Insights app to your dashboard. This simple add-on will give you access to in-depth Story analytics. With access to insights from all of your social media accounts in one place, you’ll have a bird’s eye view of your strategy at all times.
With Hootsuite, you can also export Instagram reports to CSV and PDF files — a feature that is not currently supported by Instagram’s native Insights tool.
Learn more about using Panoramiq apps with Hootsuite:
Other ways to view Instagram Story analyticsYou can also view Instagram Stories stats in Facebook’s native business dashboards. For more information, check out these resources on how to use:
Instagram Stories metrics are split into three categories: Discovery, Navigation, Interactions.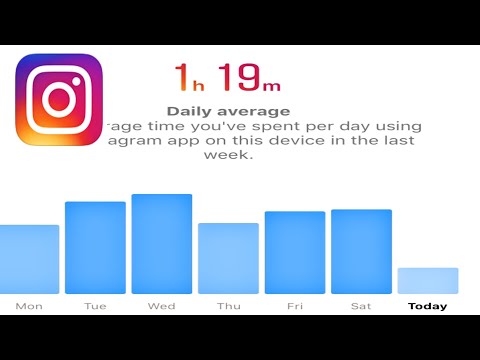
Why discovery stats matter: People use Instagram to discover brands. And 62% of people surveyed by Facebook say they’re more interested in a brand or product after seeing it in Stories.
Compare reach and impression numbers to your follower count to gauge how much of your audience is watching your Stories.
Tip: Add stickers to boost the discoverability of your Stories. When you use a hashtag or location sticker, your story is more likely to appear in Explore or the sticker’s larger story. If you run a small business, use the Support Small Business, Gift Cards, or Food Orders stickers.
Source: InstagramInstagram Story analytics: Navigation metrics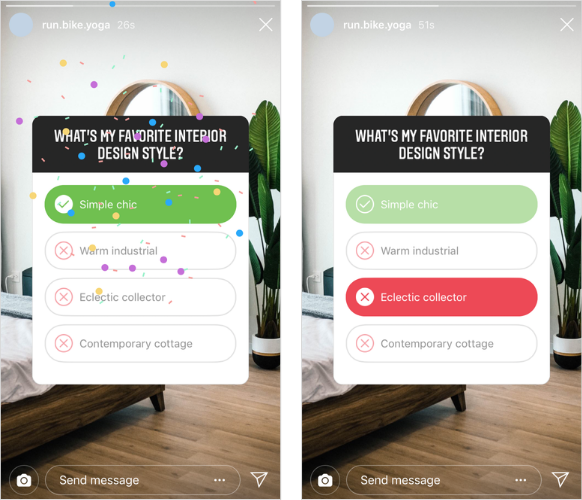
Why navigation stats matter: Navigation metrics show you what’s working and what isn’t. If a lot of viewers exit or skip to the next story, it’s a good sign your content isn’t capturing attention. Back taps, on the other hand, suggest your story shared content or info people wanted to see twice. This may also be a good one to save to your Instagram Story highlights.
Tip: Keep Stories short and sweet. People aren’t looking for long-form content here. A 2018 study by Facebook IQ found that Story ads performed best at 2.8 seconds per scene.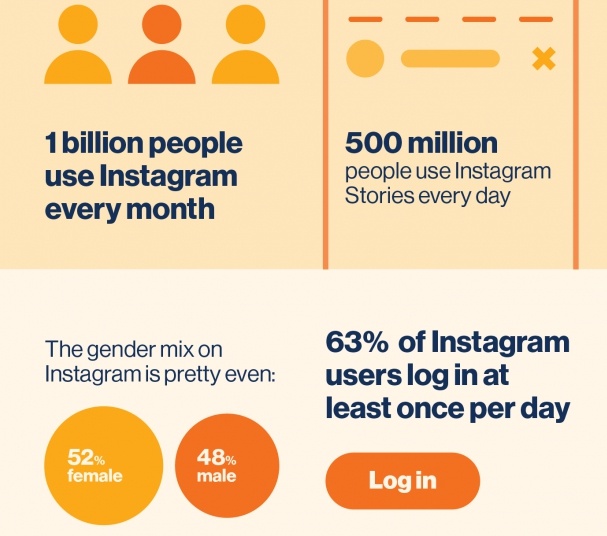

Why interaction stats matter: If your goals include engagement or other actions, interaction stats help you measure your success in achieving them. If your goal is to get more followers, compare Profile Visits with Follows. Did you want your story to drive traffic to your website? Website visits will show you how it fared.
Tip: Stick with one, clear call-to-action that aligns with your goals. Emphasize your CTA with branded stickers, or creative that emphasizes it. Facebook data found that highlighting CTAs drives significantly more conversions for 89% of studies tested.
More things you can measure with Instagram Stories analyticsHere’s how to measure Instagram Stories metrics like sticker taps, engagement rate, and more.
How to measure hashtag and location sticker performance on Instagram StoriesInstagram story stickers include hashtags, locations, mentions, and product tags. In other words, stickers are basically tags that viewers can tap to see related content. Like tags elsewhere, these stickers can also help a story reach a larger audience.
Sticker taps count as interactions and can be found under Interactions. If you haven’t used any stickers, you won’t see this metric.
How to measure engagement on Instagram StoriesInstagram story engagement metrics can be found under interactions. There’s no agreed-upon formula for measuring story engagement. But there are a few ways to think about it, depending on your goals.
Compare reach with follower countDivide story reach by the number of followers you have to gauge what percentage of followers are viewing your Stories. If one of your goals is to engage followers or promote awareness, keep an eye on this.
Total reach / Follower count *100
The average Instagram story view is 5% of your audience, said James Nord, founder of influencer marketing platform Fohr, in an Instagram Live interview with Matthew Kobach, manager of digital and social media for the New York Stock Exchange.
If you think this figure is low, consider promoting your Story with an Instagram post. Here’s an example:
Compare reach with interactionsView this post on Instagram
A post shared by Instagram for Business (@instagramforbusiness)
Divide total interactions by total reach to see the percentage of viewers who took action after seeing your story.
Total interactions / Total reach * 100
Compare reach with a key interactionFocus on the interaction that best aligns with your goal. If your call-to-action is to Follow Us, divide Follows by reach. This will show you the percentage of viewers who took the action.
Key interaction / Total reach * 100
Pro tip: Remember not to compare apples to oranges.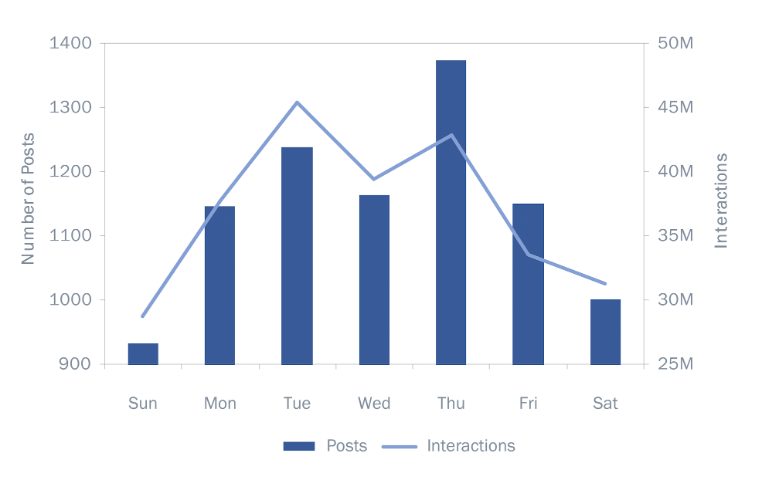 Whatever way you choose to measure engagement, make sure you’re consistent. That way you can make fair comparisons and see what’s really working and what’s not.
Discovery is tricky to measure on Instagram Stories, since Instagram doesn’t differentiate between Instagram accounts that follow you and accounts that don’t.
Reach shows you how many people are watching your Stories. But to drill down on discovery, keep an eye on Profile Visits, Follows, and Website Clicks. These metrics measure viewers who likely weren’t following you, but liked your story enough to check out your profile, hit the follow button, or visit your website. Watch Shares, too. A share is a great way to be discovered, and could drive more follows.
Instagram recently introduced Growth Insights, which allows you to see which Stories and posts earned the most followers. To check these insights, go to the Audience tab in Instagram Insights. Scroll down to Growth where you’ll find a chart that shows you follower changes by day of the week.
Don’t forget your stickers. Check the viewer numbers of other Stories associated with your stickers under Viewers. But act fast: this data is only available for 14 days. Keep track of the stickers that bring the most viewers.
How to measure traffic from Instagram StoriesCompared to most social networks, Instagram doesn’t offer a lot of places to refer traffic outside of the app. Brands were stuck with “link in bio” call-to-actions until Instagram rolled out the Swipe Up feature for Stories.
It’s tricky to measure how many people Swipe Up. The best way to do it is to add UTM parameters. These are short codes you add to URLs so you can track website visitors and traffic sources.
Tip: Highlight Stories with links so people can keep swiping outside the 24-hour window.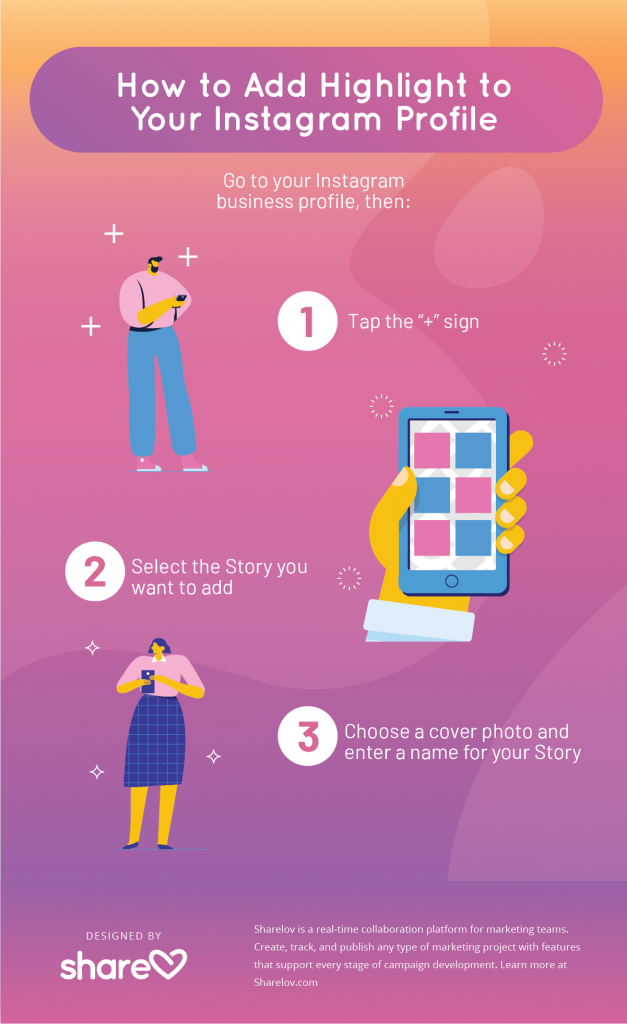
You can also track Website Visits. This measures how many people visit the link in your bio after seeing your story.
The Swipe Up feature is only available to accounts with 10K+ followers. Here’s how to earn more followers on Instagram if you need help hitting that number.
Download your free pack of 72 customizable Instagram Stories templates now. Save time and look professional while promoting your brand in style.
Download the templates now!
How to see when your audience is most activeInstagram Stories are only live for 24 hours, unless you add them to your highlights. Post them when your followers are most active to ensure they don’t go unseen.
Follow these steps to see when your audience is online:
 See if there are any noticeable peaks.
These are the best (and worst) times to post on Instagram.
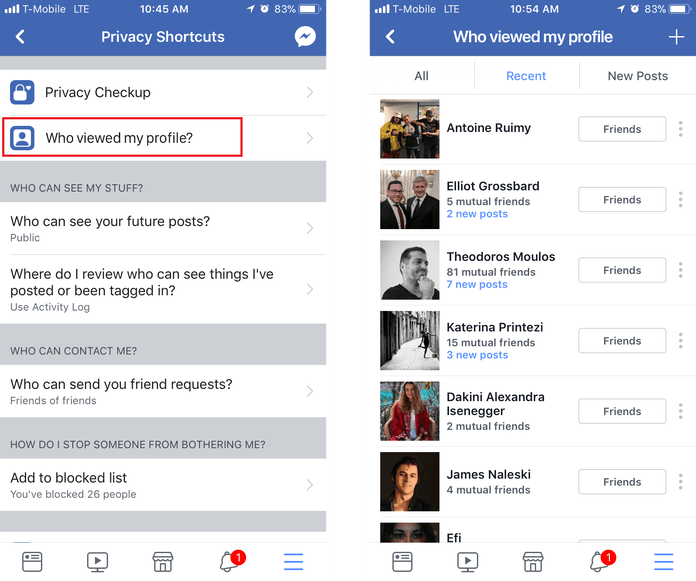
How to track Instagram Stories you are tagged inInstagram recently made it easier for creator and business accounts to track story mentions.
Now you can see any story that mentions you at the top of the Activity tab. To access Stories About You, tap the heart icon, then Mentions under Stories About You. From there you can look at each post, add them to your own Stories, or simply thank them for the love.
Source: @InstagramforbusinessThis includes when people use the Support Small Businesses sticker. Right now, Stories that use this sticker are added to a larger story that appears at the top of feeds. If you run a small business, be sure to benefit from the added exposure.
How to optimize your strategy based on your Instagram Stories analyticsHere’s how to use Instagram Insights to inform a great Instagram Stories content strategy.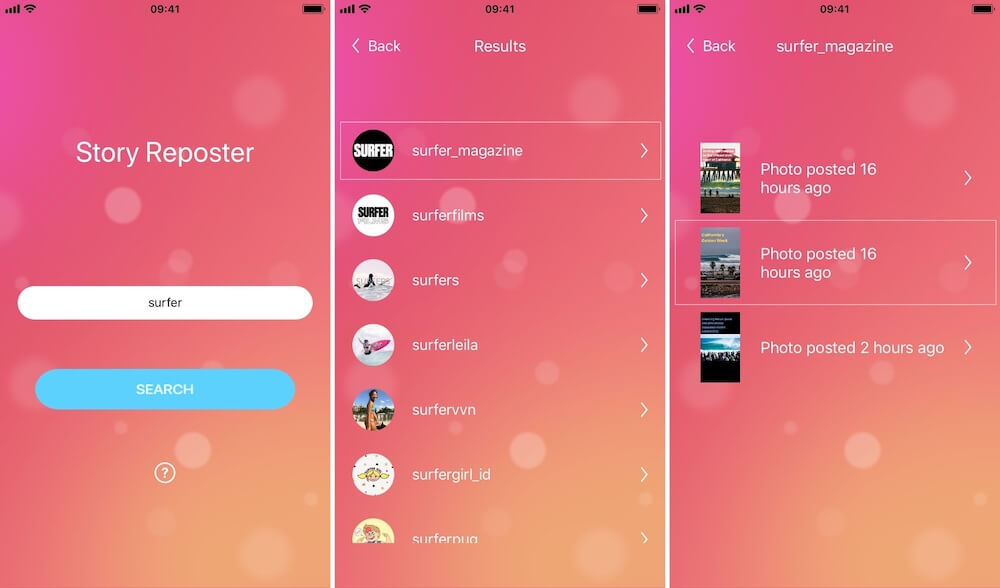
Understanding how your Stories are performing over time will help you pinpoint top performing posts. If you spot photos and videos that outshine other Stories, look for ways to recreate it.
Turn successful ideas into concepts. Run polls or quizzes around different themes or spin a successful tutorial into a recurring series. For example, Culture Hijab posts regular tutorials on different ways to wear hijabs.
Source: @culturehijabOn the flip side, don’t panic if something flops. Stories are an ideal place to experiment and learn. Fortunately, if an idea doesn’t take off, it disappears in a day.
Need some inspiration? Pick up tips from 7 of the best brands on Instagram Stories.
Listen to audience feedbackQualitative data is just as important as quantitative. If you’ve used poll, quiz or question stickers to engage your audience, pay attention to responses.
Use feedback to inspire new products, services or content. And don’t be afraid to ask directly. People like having their voices heard. The LA County Museum of Art recently ran a poll that asked viewers to share what content helps them de-stress. Then it gave the people what they wanted: Cats.
Learn how people prefer to communicate with youView this post on Instagram
A post shared by Instagram for Business (@instagramforbusiness)
Between stickers, replies, and call buttons, there are lots of ways for followers to get in touch with you. But some options may be preferred over others.
Take a look at Call, Text, and Email metrics to see if one stands out. If you’re getting more emails than calls, adjust your call-to-actions (and support services) accordingly. You might just see more bookings, orders, or inquiries as a result.
It may seem like a minor tweak, but communication methods can be a hang-up for some customers. Sometimes it’s generational. Millennials have been accused of avoiding phone calls. Non-native language speakers may feel more comfortable over email.
me, a millennial, exhausting every possible option in a situation other than making that quick phone call:pic.twitter.com/ZG9168DeFZ
— J.R.R. Jokin' (@joshcarlosjosh) February 24, 2020
Don’t ignore Replies, either. If people are sliding into your DMs, it may be time to organize your Instagram Inbox. Professional accounts have access to two-tab inboxes. Move messages between Primary and General tabs to ensure you get back to people efficiently.
Ready to start scheduling Instagram Stories and save time? Use Hootsuite to manage all your social networks (and schedule posts) from a single dashboard.
Get Started
Easily create, analyze, and schedule Instagram posts, Stories, and Reels with Hootsuite. Save time and get results.
Free 30-Day Trial
To prevent this from happening, analyze which topics and story formats received the most views and responses, and which, on the contrary, scrolled forward because they were not interesting to subscribers. Some of the statistics can be obtained in the Instagram application, however, it has two big drawbacks:
Few metrics to analyze. For example, you can see how many users clicked the back navigation to return to previous stories. But you can’t look at the “Forward” navigation to understand which stories they want to scroll through faster, which means they are not interesting for subscribers. It is also impossible to estimate the percentage of views of stories, and this is an indicator of keeping the attention of the subscriber and, accordingly, the quality of the content.
Stories cannot be rated by several parameters at once.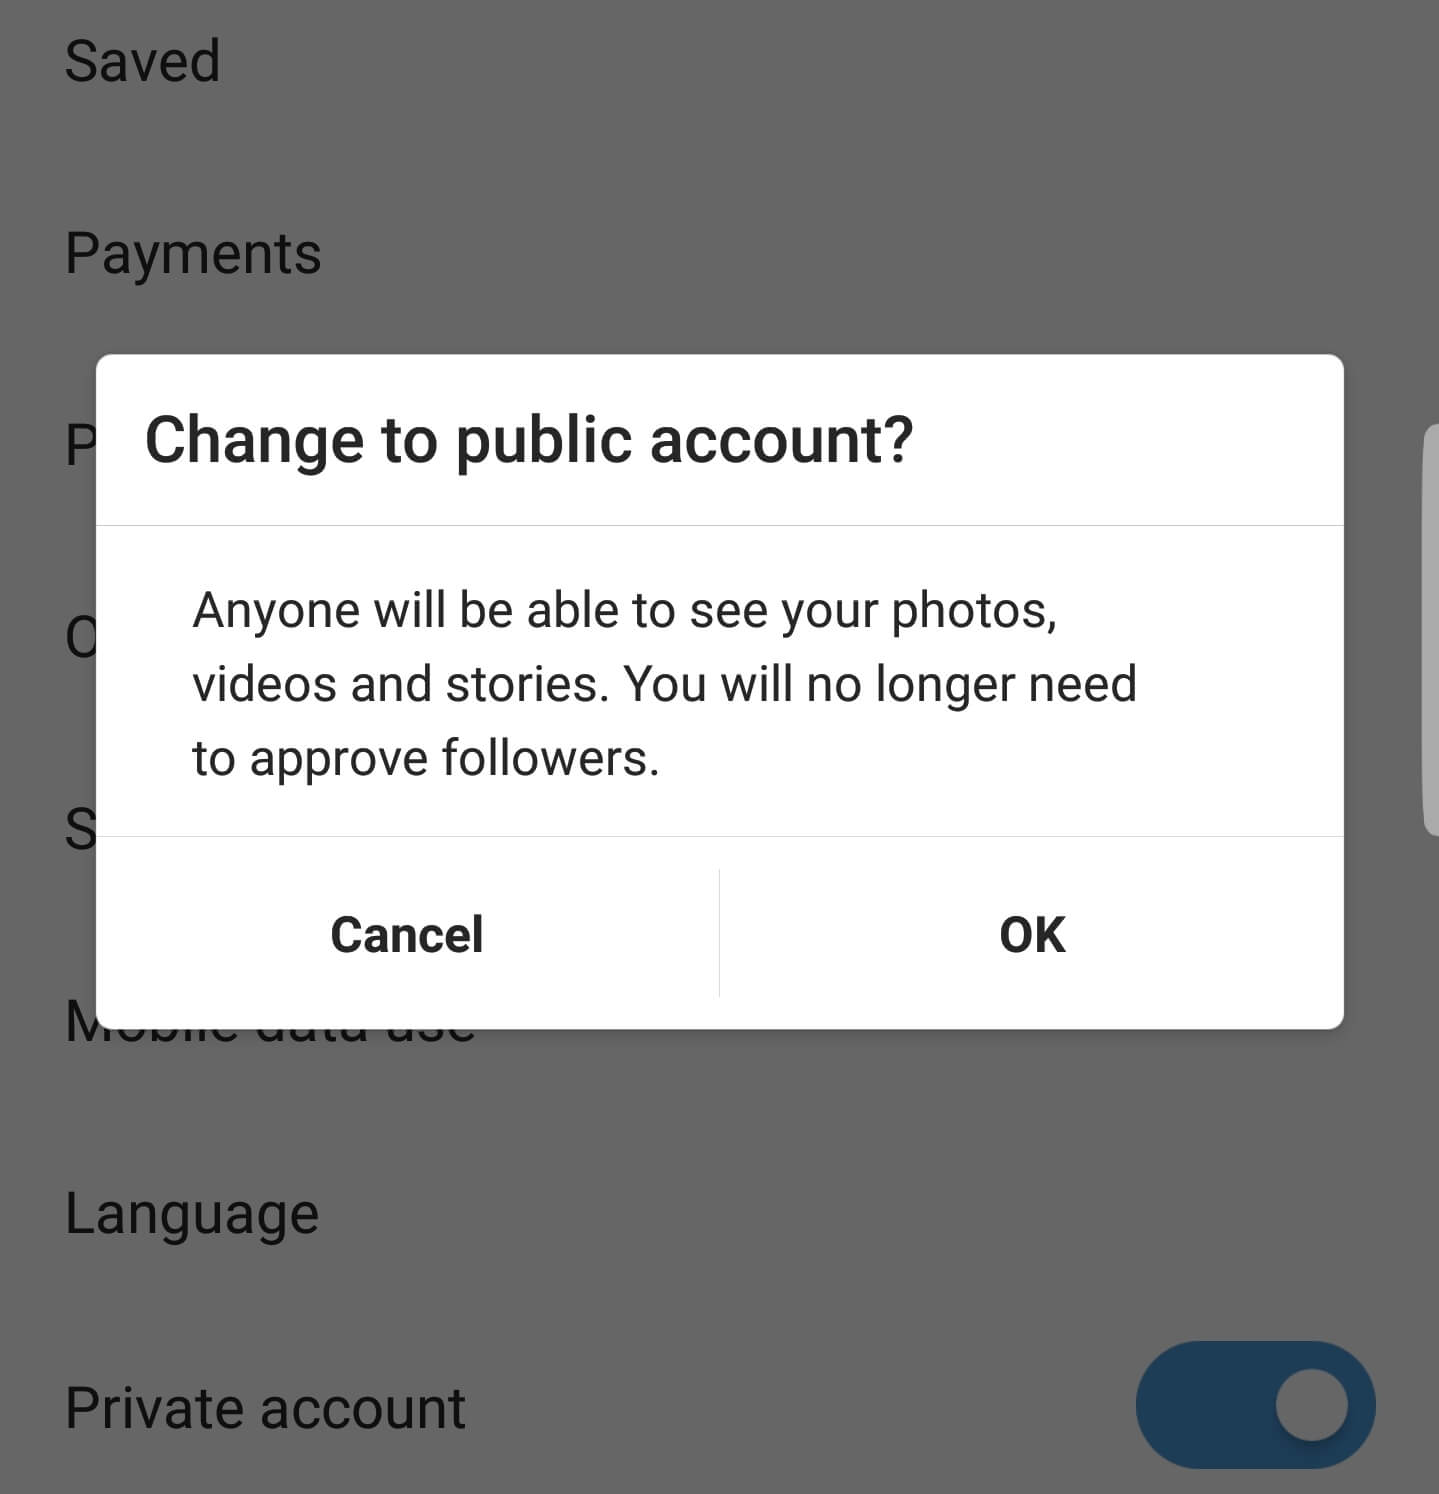 For example, you decided to experiment and introduce a new category - "Overview of stores". To understand how good a rubric is, you need to collect statistics on all stories from the rubric and display the average and total values. It often happens that some individual stories get a good response, but the rubric as a whole is weak. Well, then compare the statistics for the new rubric with the statistics of other rubrics.
You can carry out such an analysis manually: switch each parameter in Instagram statistics (impressions, reach, replies, etc.) and write data for each story to the table. This is inconvenient and takes a huge amount of time. You can simplify the analysis of stories, save time and get advanced statistics in LiveDune.
Contents
How to increase reach with LiveDune stats
How to increase stories reach with games and surveys examples
How to increase reach with LiveDune stats
 To do this, you can conduct polls and quizzes, arrange games, or even ask for reactions to selective stories. But doing this every day is not an option, as it will quickly begin to annoy subscribers and can backfire. Therefore, start with an analysis, it will give an understanding of what is already working well, what can be improved, and what should be abandoned.
 This is the total number of views of your stories.
The number of unique users who viewed your stories. For example, your friend has watched stories 3 times. In statistics, this will show up as 3 views and 1 reach.
The total number of emojis and messages sent in response to your stories. The more reactions you get from users, the closer to the start of the issue the algorithmic feed will show your stories.
The number of times the user moved to the next story without viewing it to the end (i.e. less than 15 seconds).
The number of times the user went to the previous stories to watch it again.
Number of clicks on the cross in the right corner of stories. That is, when viewing your stories, the user left the stories feed.
Percentage of users who viewed stories from start to finish.
Ratio of stories coverage to account subscribers.
Finding the most successful stories
Reach, Responses, and Views metrics will help you find your best stories. To do this, on the “Stories” tab on the table of the same name, line up the tops according to these metrics. Click, for example, on "Coverage" once (down arrow) and the stories are sorted from largest to smallest. Do the same with the "Responses" and "Inspections" metrics.
Analyze the top stories, try to understand what they have in common. Perhaps they have one category (topic) or format (image, video, repost). Maybe it's the content - you added music to them or duplicated the words you say in stories with text so that you can watch it without sound.
Finding the worst stories
There are two ways to find the worst stories. First, build the antitop according to the Reach, Responses, and Views metrics (double-click on the desired metric - up arrow). Also try to find out what they have in common. Next, build a top according to the Forward and Exit metrics. They mean that when viewing stories, users often scrolled through them or even left the stories feed, perhaps because they were not interested in them.
Build top/anti-top rubrics
Add stories to find the most successful and unsuccessful topics. To do this, in the "Stories" table, click on the empty circles and set the heading for each stories, put a color on it to make it easier to navigate. Next, analyze the top and antitop rubrics in the Rubrics table. Similarly, find the most successful and unsuccessful topics of stories by "Inspections", "Reach" and "Answers". It is preferable to look at the last two metrics by the average, because the total number of stories in a rubric may differ.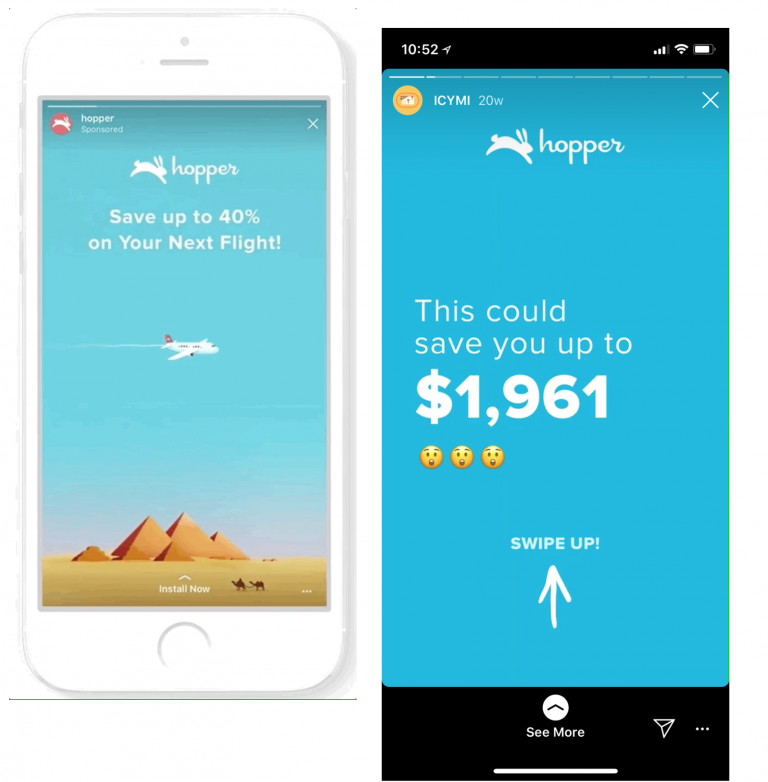 The top and anti-top in terms of Reach Rate will match the results in terms of the average Reach, so it can not be analyzed separately.
What to do next
After a detailed analysis, you will be able to understand which stories your audience likes and should be published more / more, and which ones are ignored and should be removed from the content plan as soon as possible. For example, in the course of your analysis, you found that stories in the video format are watched the most, and the sections “Poll” and “Travel” receive the most responses. These are your best stories, you can post them more often, or experiment and create related topics. The section “Building a house” turned out to be an outsider in terms of answers, but it was in the top in searches. It is not worth excluding this section, it is better to try to ask a question, ask the audience for advice. Usually the public is happy to help, for example, recommend specialists or tell about their experience.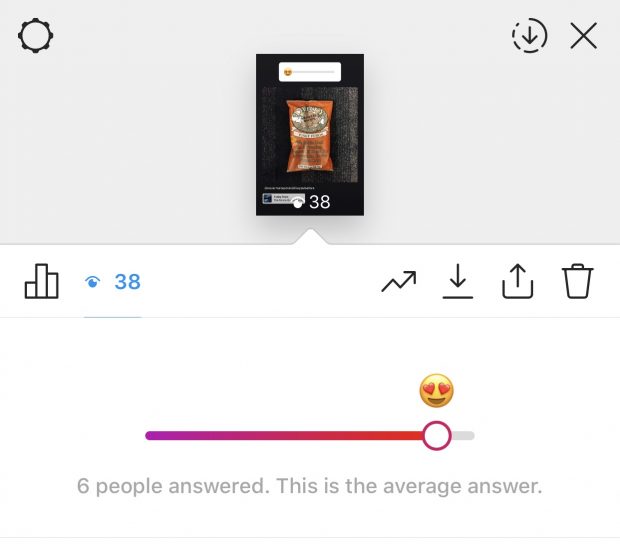 In this way, you will increase the number of responses and thereby reach.
If you don't host games or surveys, be sure to fill in this blank. Firstly, this will diversify the content, and secondly, increase the coverage, because such formats imply user interaction with stories.
How to increase the coverage of stories with games and polls: examples
Spot the difference game To do this, place one version of the picture on the first stories, and the second on the next. Next, ask users to write their answers, who found what. You can do this with the help of the "Questions" sticker.
Effect:
Users click stories back and forth, pinch stories to see differences, and submit responses. All this is beneficially perceived by Instagram algorithms and increases your reach.
Ask for an emoji reaction. You can do this with the Poll sticker or just send it in response to stories.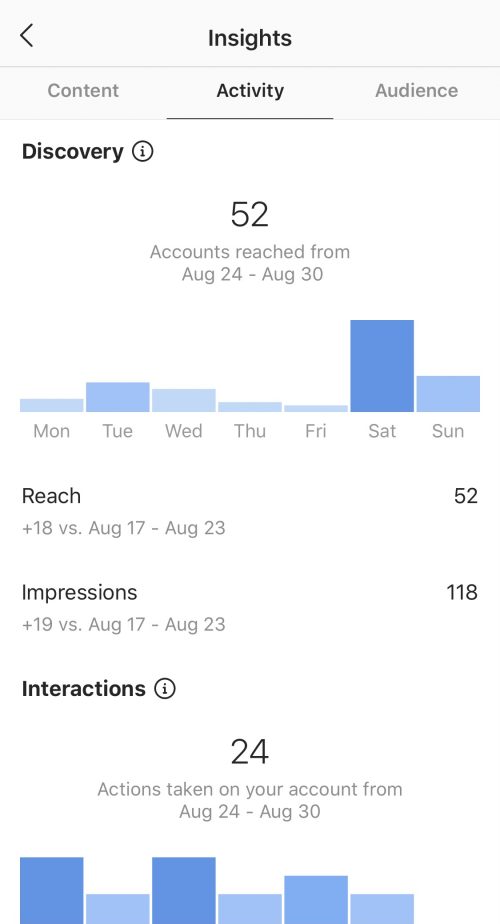 The main thing here is that the theme of stories really evokes emotion and users want to react to it.
You can add emoji by adding text to stories. To do this, click on the “A” icon and add the desired emoji to the row instead of text. And if you want to go crazy and add animated emoji to your video so that they attract more attention, see the video tutorial below.
Effect:
Users are more likely to watch stories and leave a reaction. It will also have a beneficial effect on reach.
Enter a permanent rubric where you ask the audience to make a choice. It doesn't need to be complicated, it should be simple. For example, choose a photo of the day, an image for work, etc. The main thing is to place the first version of the photo on one story, and the second on the other, so that the audience uses the Back navigation.
Effect:
they are used to it, and since the author asks, then their opinion is important.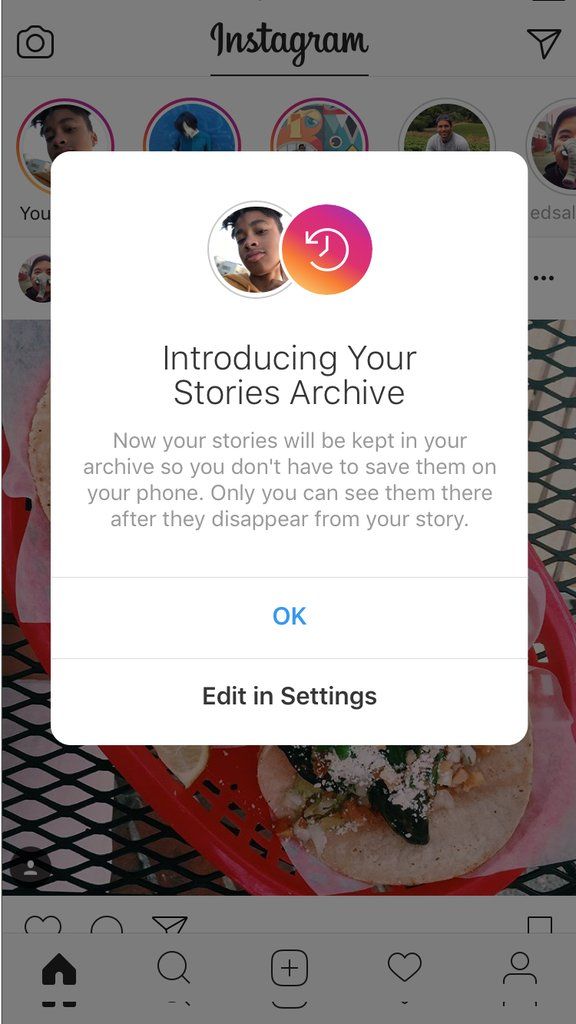 They are happy to choose by clicking “Back”, and perhaps pinching stories to view it, and voting, because this choice does not oblige them to anything.
Game find active sticker. Ask users to find, for example, an active emoji. To do this, place one real poll sticker and many fake ones in the form of a picture (to remove the background, use MagicEraser for iOS or Background Eraser for Android).
Impact:
Stories will get a high percentage of clickthroughs, as well as the use of back navigation, as some users will not be able to find the active emoji in 15 seconds.
Even more games you will find in our article - Games to engage followers on Instagram. Also hold contests and polls, all this will diversify standard stories and increase coverage.
Only important news in the monthly newsletter
By clicking on the button, you agree to the processing of personal data.
What's new in SMM?
Subscribe now and get an Instagram account audit guide
Popular articles
≈ 4 min to read 23.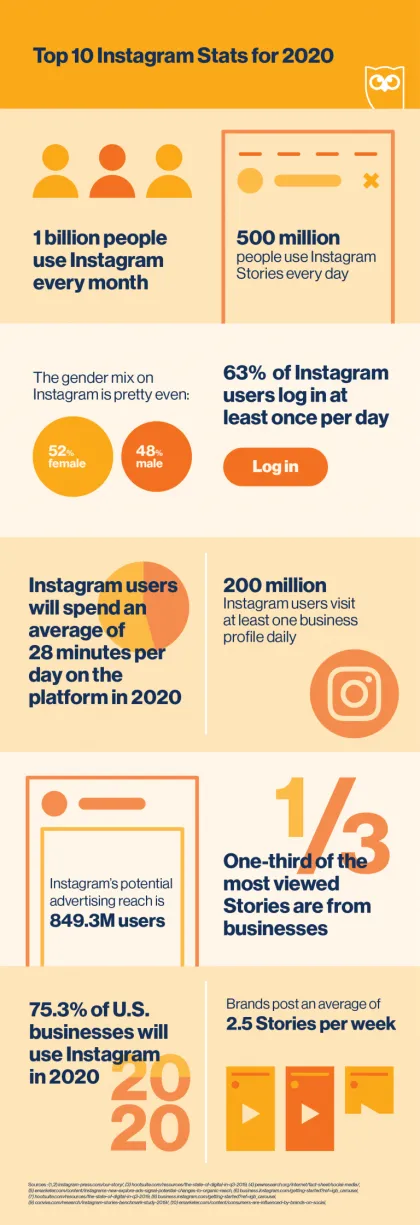 07.2020
How do I use my Instagram best friends list for marketing purposes?
With the help of stories for best friends on Instagram, you can not only limit the circle of people who will see your stories, but also hold a closed marathon, create sales chains or run a competition through and through.
#instagram 09/18/2019
Where to look for Instagram content ideas
8 adequate ways to find content ideas for Instagram when there is nothing to post.
#instagram 09.09.2019
How to make ad layouts for stories
A selection of apps for creating videos and animated ad layouts for Instagram stories.
#instagram 04/09/2019
11 video editing apps In order for the video to cause admiration and reactions from subscribers, you need to process and edit it beautifully.
LiveDune Marketing Products - 7 days free
Our products help optimize your social media experience and improve your accounts with the help of deep analytics
Analysis of your own and other people's accounts using 50+ metrics in 6 social networks.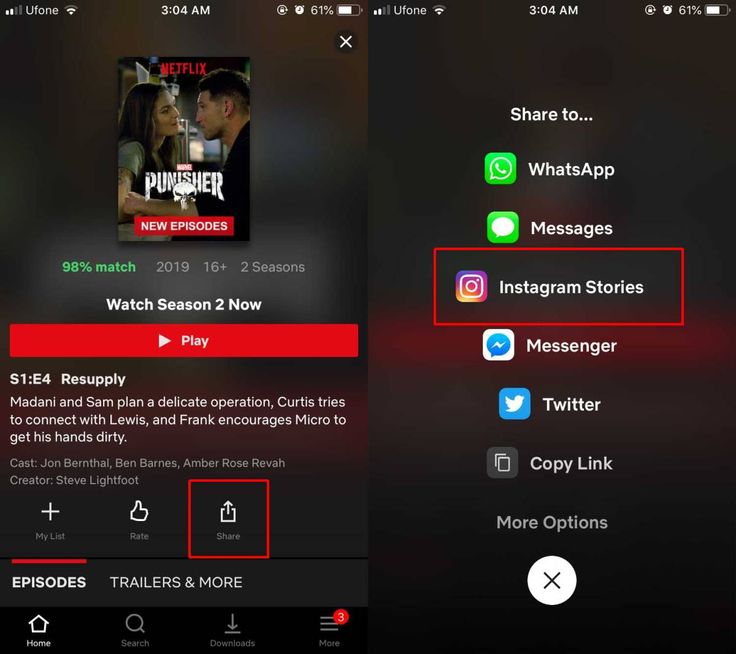
Account statistics
Message processing optimization: operators, statistics, tags, etc.
Direct Instagram
Automatic reports for 6 social networks. Upload to PDF, Excel, Google Slides.
Reports
Monitoring the progress of KPI for Instagram accounts.
Audit of Instagram accounts with clear conclusions and advice.
Express audit
We will help you to select "pure" bloggers for effective cooperation.
Checking bloggers
.
Instagram account statistics could only be viewed using third-party services and programs, but now it can be done in your own account and even from a computer to Facebook in Creator Studio. Where is this statistics and how to do it on Android and iPhone?
Instagram statistics for the account as a whole, individual publications and Stories can be viewed for free, but first you need to create a business account or an author account.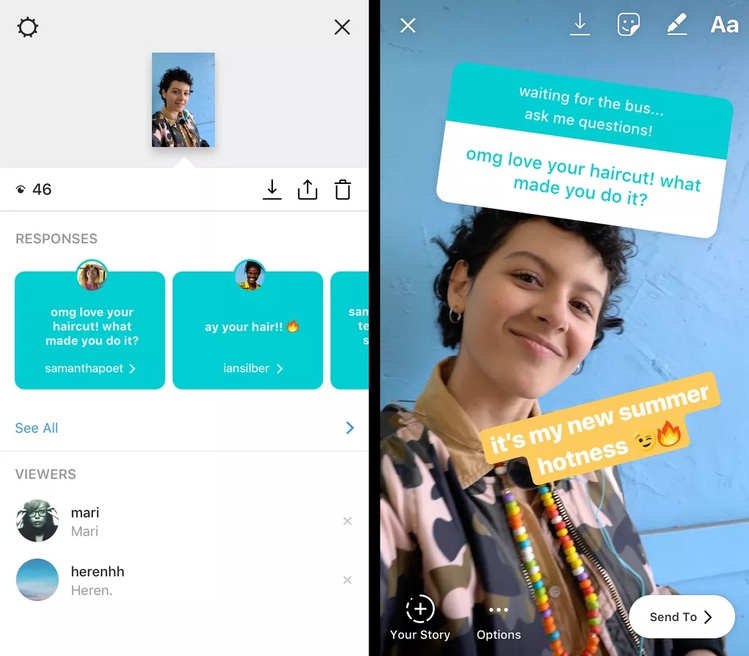
👉 How to make a business account on Instagram
You will have photo and account statistics after switching to a business profile or author account . You can do this for free. Previously, it was necessary to link the Facebook page. But now this can not be done.
But in order to run ads directly in the application, Facebook still has to be linked. To do this, you need to remember your e-mail and password from your Facebook account, as well as create a public page for your business account.
After transferring to a business account or an author account, you will see the inscription “View professional panel” at the top and the “Statistics” button.
If you immediately click the button, then you will immediately go to the Statistics of your Instagram profile.
If you click "View professional panel" - then you can see all the tools for working with a business account / author account.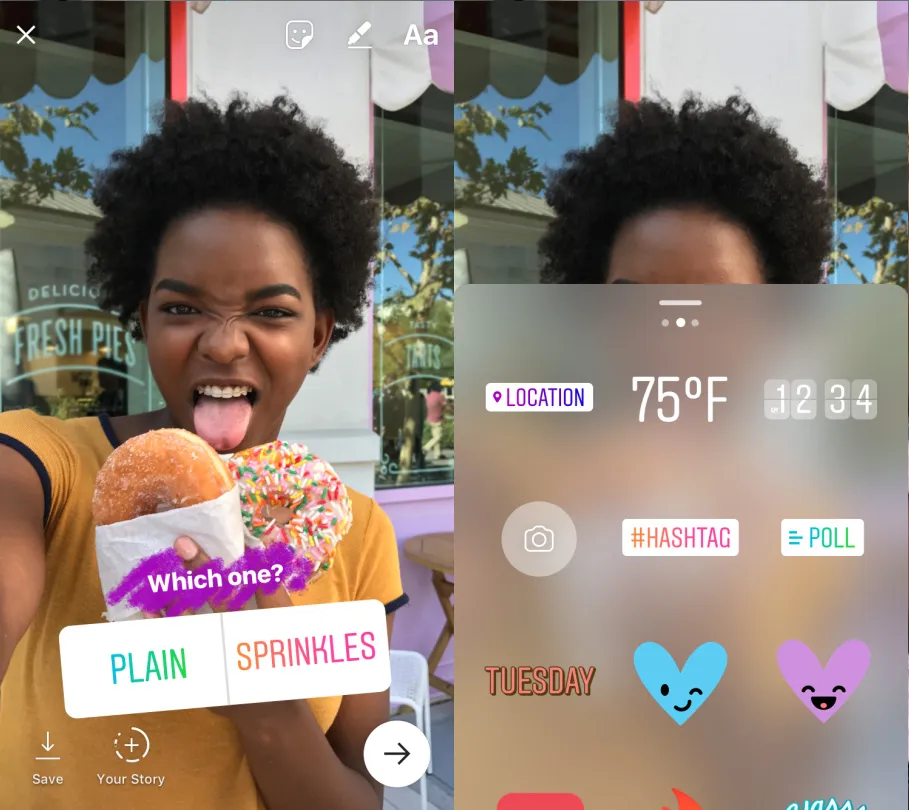 Including there will be a line "all statistics".
The third way to view Instagram statistics - in your account, click the three bars at the top right and select "Statistics"
Instagram account statistics can only be viewed from the current moment. Everything that happened before, no one will ever know =) Therefore, you will see some intelligible statistics for the entire account within a week, and only new posts will have photo and video statistics.
Statistics are needed not only to track the progress of an account, but also for potential advertisers who ask for Account Reach and Engagement before buying ads. What does Instagram stats mean?
On the main screen, you can select a period from the top - statistics for the last 7 days or 30 days.![]()
Accounts Reached - is the total number of people who saw your posts, Stories and IGTV) in a week, plus a comparison with last week. It differs from Impressions in that here each person (account) is counted only once, even if he watched your posts several times. Therefore, Reach will always be less than Impressions.
👉 Instagram reach: what is it and how to increase it?
Click on Covered accounts and more detailed statistics will open.
Subscribers and everyone else (by reach) - how many of the audience covered were subscribed to you, and how many were not.
Content type - which content received the most coverage (also broken down by subscribers and unsubscribers)
Here you can also see which posts were the most popular in terms of reach. And if you press the triangle bracket 9 on the right0009 > , then you can filter statistics on Instagram by other indicators (comments, likes, subscriptions, etc. ).
).
Impressions is the total number of content views. One person could watch several times, different content. Therefore, impressions are always more reach.
Actions in the profile are visits to your Instagram account plus clicks on the buttons in the account header (e-mail, store, phone, etc.).
YOUR AUDIENCE
Return to the first Instagram Insights screen. In the "Your Audience" section, click the triangle bracket on the right > . Statistics on subscriptions and unsubscribes on Instagram will open.
Increase - on this graph you will see the number of subscribers, unsubscribers and total (subscriptions minus unsubscribes).
Below are statistics by location, age and gender.
Peak periods - time (days and hours) when followers were most often on Instagram.
CONTENT YOU POSTED
Return to the first screen of Instagram Statistics.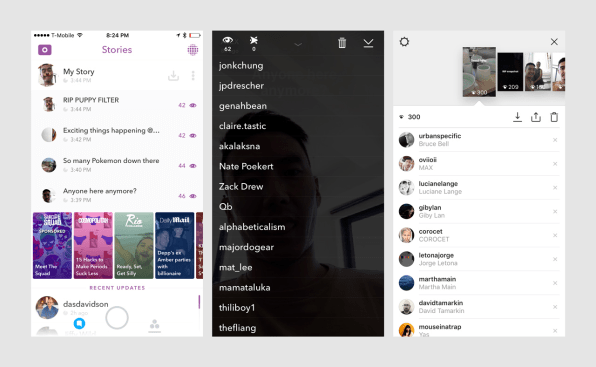 In the "Content you've posted" section, you'll see the number of posts/Stories/IGTV/Promotions in the last 7 or 30 days (depending on the filter on the top left). For each type of content, you can filter by all engagement indicators (impressions/reach/likes (likes)/comments/saves).
This will help you better understand the results of advertising from bloggers or giveaways. But this is only available for profiles with more than 10,000 subscribers. You can wind them up and go to the author’s account, especially if you don’t have enough 1000 subscribers and can’t wait to get new statistics right now. This will not hit the account engagement much. But ideally, of course, you need to grow organically, with the help of advertising from bloggers and targeting.
To find out the statistics of views (and not only) of each publication - photo or video on Instagram, you need to open the desired post and click "Statistics".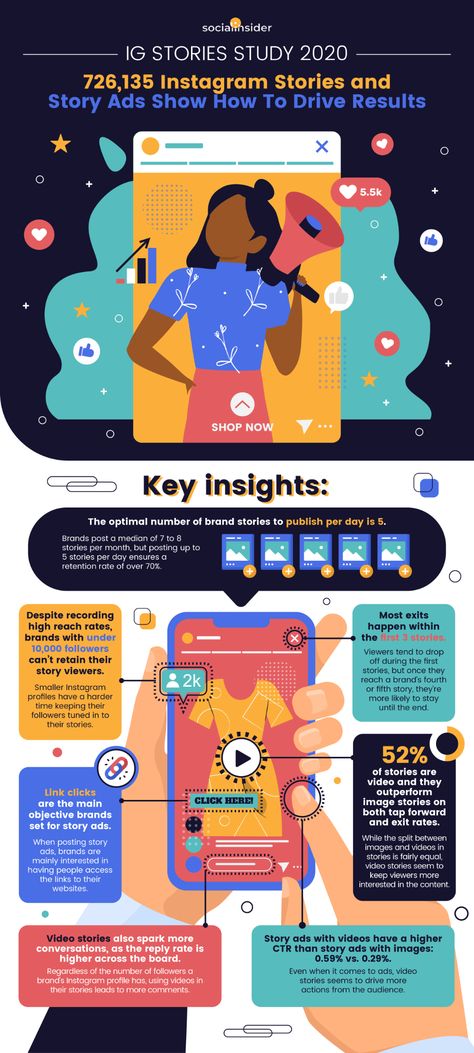
The top line of statistics is the number of likes, comments (👉 Comments on Instagram: how to talk subscribers), transfers to Direct and saves.
Saves - how many times the "save" button was pressed.
Visits to profile - how many times they went to the account from this photo.
Reach - how many people viewed the photo. On average, there should be 30-60% of subscribers. Less - a lot of bots that do not look at posts. More — if you ran an ad, got featured, the post turned out to be very popular, shared, etc. The larger your account, the smaller the reach in % of subscribers. Old followers abandon accounts or lose interest. This is fine. The highest coverage (in % of subscribers) is for accounts with up to 1000 subscribers. To increase your reach, be sure to post regularly, with a content plan. Even according to the coverage statistics on Instagram, you can understand whether you published a post at the right time or not.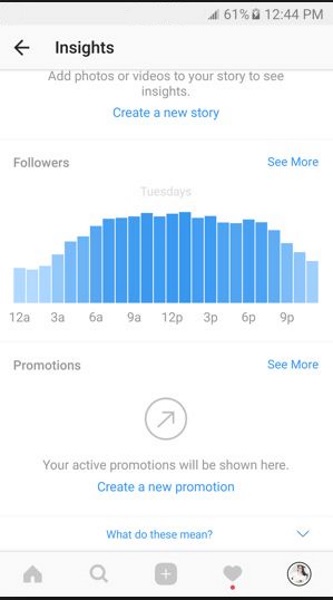
If you swipe up on these statistics on Instagram, you can find out even more interesting things about the statistics of the post.
Profile visits - how many people went to your account after seeing this post
Reach - how many people saw your post.
Impressions - how many times your post was viewed. One person can view multiple times, so impressions are always more than reach.
From main page - how many people saw the post in the feed
From "Interesting" - views from the recommended tab, with a magnifying glass. The more, the more likely that the post has become "viral" (it is sent to friends, it appeared in the recommended). Also, a large percentage happens if you promoted a post.
From profile — how many people saw the post by logging into your account
From hashtags — how many came from hashtags
From “other” - all other sources
In a personal account, you can only see the total number and accounts of those who saw your Stories. To do this, swipe up from the bottom of any Story on Instagram.
After switching to a business or author account, you will have detailed statistics for each Stories on Instagram. What does each statistic mean?
INTERACTIONS
Total statistics on the number of reactions to your Stories:
Replies — how many people answered you in Direct on this Story
Clicks on the link — how many times after this Story they went to your account and clicked on the link in the description.
Visits to profile - how many times after this Story they went to your account.
REACH STATISTICS
Here you will see statistics on how many people see your Stories and how they find them:
Accounts covered by this Story (Reach) - the total number of people who saw this Story
Impressions - the number of times this Story was viewed .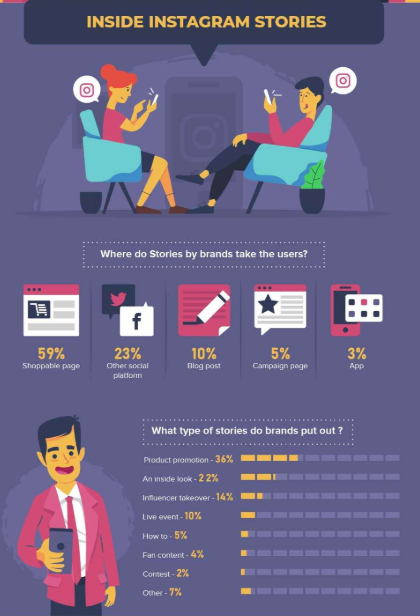
Subscriptions — how many subscriptions after this Story.
Navigation = back + scroll forward + jumps to next story + exits
back - number of taps back to your previous story0003
Forward - number of taps forward to view your next Story
Next Story - number of scrolls to the next account's Stories. Here you can understand whether was interesting or not was History , whether the person wanted to watch your content further or moved to the next account.
Exits — number of exits from the Stories view mode. Again, you can see the statistics of how the Story was able to keep the attention of subscribers.
Do not draw conclusions after the first week, how to connect free statistics on Instagram. Check how it will change for at least a month. Compare weekdays, weekends and holidays, good/bad weather outside.
Don't be in a hurry to "give it all away" if your coverage dropped in late spring and summer. Previously, no one had such statistics, and people who do not know the general trends in social networks and the Internet are afraid of fluctuations in statistics in their Instagram account. In the fall and after the New Year holidays, there is always an increase, and in the spring and summer there is an outflow. Of course, this does not apply to "seasonal" businesses (spring-summer travel agencies have growth, for example).
Even though many of us have a smartphone as an extension of our hand, we still scroll through Instagram less when we are on vacation, it’s summer outside, etc. Therefore, do not rush to arrange another giveaway or pour extra money on advertising if your coverage decline is seasonal. But do not abandon your account, if necessary, make pending posts for the holidays. Then even if you yourself are resting, you will still flicker in the feed of subscribers.
You will have the most reliable statistics a year after you make it.