Unfortunately, Instagram doesn’t allow you to easily download Instagram analytics from your account. You can open your Instagram Insights on your desktop or phone, but you can’t download a whole report. So then… what’s the solution?
The only way that you could ever download Instagram analytics is by screenshotting the results and compiling data together. Instagram doesn’t support exporting your data as an Excel sheet or a PDF, so this is the only choice you have if you’re not willing to spend much.
You can potentially check your Instagram Insights on a desktop by using Creator Studio. Creator Studio allows you to publish content, so we understand the appeal of using it for content and analytics. However, you will see there your data for the last 7 or 30 days only. That means you would have to compile data every week, or every month, before it disappears!
It takes up a lot of time and you’ll have to revisit Creator Studio frequently.
The alternative is the simplest solution if you have money to spare.
Although you might want to skip paying for a third-party application to download Instagram analytics for you, there are a few reasons why you should. We’ll be using Sotrender, our own tool, to make our point. 😉
Firstly, you won’t miss out on any of the classic Instagram analytics from Insights. All of the same metrics will be featured in all of your reports and analyses. On top of that, you will see additional metrics like the Activity Index to get a better summary of user activity and engagement.
The second benefit is that you can download specific graphs and data if you don’t need a whole report. All you have to do is press the download button, and you’ll have what you need. You will also have more control over the number of days you want to analyze. This will make it easier to go back and compare the results of specific marketing campaigns or periods of time! Keep in mind that Sotrender starts gathering your historical data from the moment you link your profile to the tool, and since this data won’t disappear, you can go back to it whenever you need a comparison.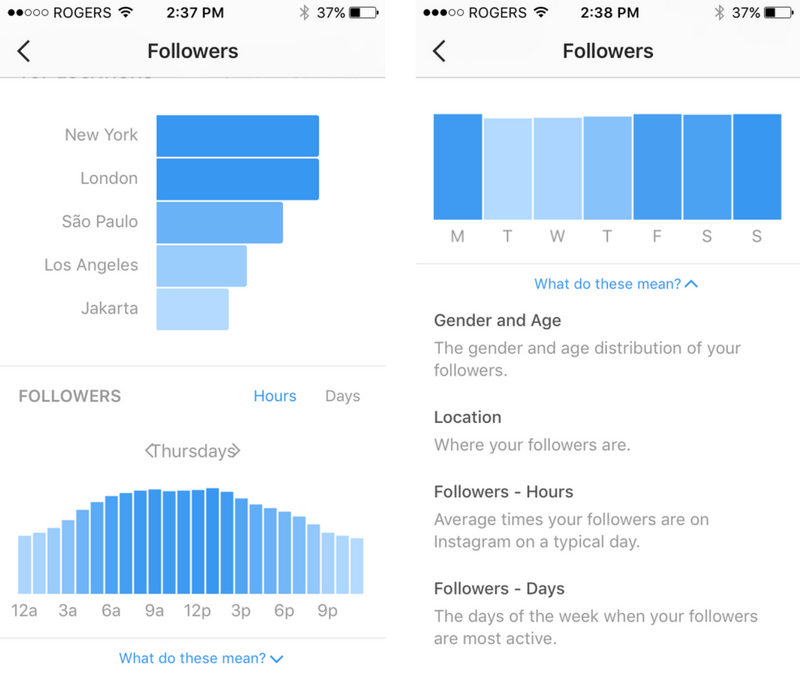
On another note, you’ll notice that you’ll be able to interact with your graphs. Just click on any of the days where you see activity, and you’ll see what you posted that gave you more or less engagement than usual. Now you’ll know what type of content is more interesting to your audience and avoid what they don’t engage with.
Finally, you can cut yourself some slack and get all of the data delivered to your email whenever you need it. Open the reporting tab and schedule a recurring report that will be delivered when you need it.
You can even customize the contents of the report with just a few clicks. It’s also good to know that you can skip anything that’s redundant!
A report can have around 30 pages if you include all of the reported sections. Pick and choose what you need to make it shorter.
What is more, you can fully automate the reporting process. That means you don’t have to head to the reporting section every month and go through the same process over and over. You can do it once, and then on a selected day (e.g. the first day of each month) a ready report will be automatically sent to your inbox. 😉
Want to take a peek at how such a report looks like? Here’s a sample to give you a better idea of what you can expect.
The first thing you will see when you open your report is the table of contents. You can check out the specific section that interests you by just clicking on the title. 🙂
To keep things simple, we’ll just show you a few metrics in the report and their summaries. In the first example, the report includes a basic summary of the best and worst times to post on Instagram based on the number of online followers. This gives a brief answer to the question “when should I post my content?” Problem solved.
If you were curious about when you had the most people seeing your content, you’ll know. You can see that something that was posted on Thursday got a lot of attention and got spread pretty far.
And if you were interested in checking out the proportions of user activities, then you’ll get your answers with this simple bar graph. You get the benefit of seeing a comparison to the previous period which you otherwise wouldn’t be able to see in Instagram Insights.
That’s really all you have to know about downloading Instagram analytics and exporting data. Use Sotrender’s reporting feature according to your needs and focus on other activities. There’s a free trial that you can try out in case it sounds relevant to you. 👇
Think about your budget and whether it makes sense for you to subscribe to an external social media analytics tool. You know your business the best and what’s realistic for your budget. Good luck and happy analyzing! 😉
Did you like the article? Share it with friends.
Share Tweet ShareIva Djukic
Marketing Specialist
Graduated from University of Warsaw with a Master's degree in psychology. Can be found binge-watching Netflix, reading, or spending time on social media.
go up
Posted 03.15.2022 by Josh Krakauer
The Google search turned up empty. Panic set in.
Result after result promised a software solution or offered a non-answer.
Maybe that’s why you’re here now. Hi, hello. I am you.
Before you proceed down a painstaking path, let’s cut to the chase:
 But there are limitations.
What’s the issue here? And what’s the solution?
Instagram provides a wealth of data about how your audience interacts with your content. In the app, you can view insights about about your stories. Data-driven marketers may want to take advantage of that information to observe trends, measure social media ROI, and inform their social media strategy. Exporting your data into a centralized reporting dashboard can help.
Instagram Stories insights includes data on interactions like:
All of these metrics are available in the Insights section of your Instagram app for archived Stories dating back 14 days. Though you must have a Professional (business) account to view the Insights.
These metrics are available in the API, too. The Instagram Insights API allows developers to access data about Instagram “media objects” (including Stories content) and interactions.
Need to access Stories data that’s older? The API used by third-party tools can help. But there’s a catch.
Facebook/Instagram states there are limitations to what it provides developers. That means your enterprise analytics tool with all of the bells and whistles can’t get past these restrictions, either. For instance, the API doesn’t report engagement metrics of Stories ads, those are accessed separately.
But here’s the real kicker. Instagram states:
Stories insights are only available for 24 hours, even if the stories are archived or highlighted. If you want to get the latest insights for a story before it expires, set up a Webhook for the Instagram topic and subscribe to the story_insights field.

Basically, act fast, or it’s gone for good.
Approved partners can capture Instagram Story insights and pull them into their own database before they expire. However, this quote seems to indicate you can not access data on”expired” Stories through the API.
If you need granular data on Stories that published before the connection, you’re out of luck.
If you want to store, report, and visualize your Instagram Stories data, you will need to export it from Instagram. To export Instagram Stories Insights into a format like a CSV you have two options: Manual entry or third-party tools. There are limitations to both.
✅ Option A: Manual entry.
When asked, several social media marketers shared that they manual enter their Stories analytics into a spreadsheet. In the app, Professional profiles can access data on their content performance and select the interaction they want to load.
This method requires patience, persistence, and prioritization.
✅ Option B: Third-party tools.
Many popular Instagram analytics platforms can report on Stories content performance. Most will visualize the data in their own dashboard. Some will allow you to export the data manually for further analysis.
There are a number of powerful, third-party Instagram tools that give you access to granular Stories data you can export. All of them are limited in their ability to access data beyond the day you connect the service, so keep that in mind.
Paid Instagram analytics tools that will let you export data after you authenticate your profile include:
Every marketer has a weapon of choice. At Sculpt, we have been using Minter.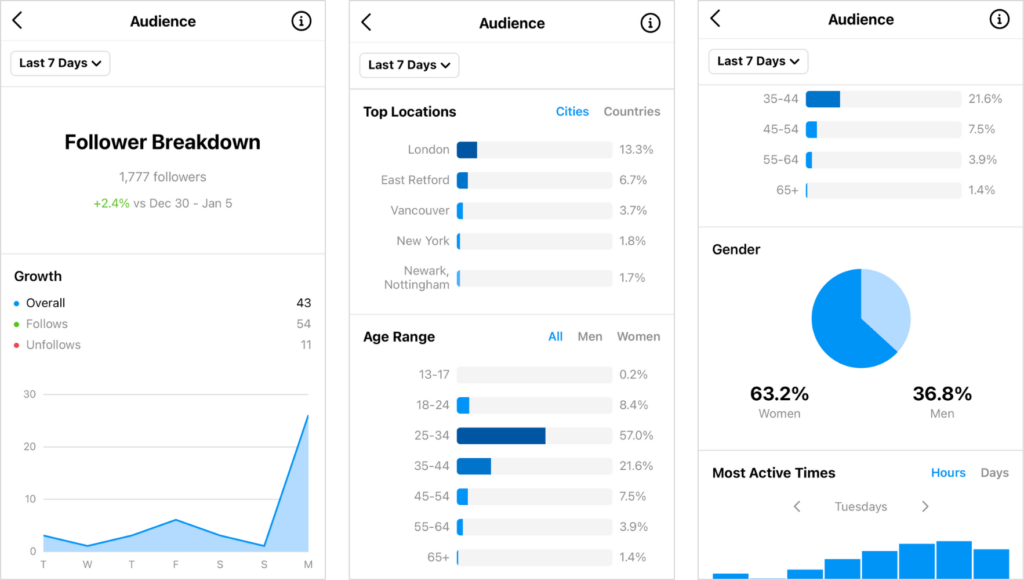 io as our Instagram reporting tool for 3+ years because it’s extremely impressive for its price. One of our favorite features is the built-in benchmarks. Wondering if your follower growth is above or below average for accounts in your size range? Their data will tell you.
Minter.io features include:
If you’re interested, just click here to learn more (it’s an affiliate link, but we asked for it 😎).
Several tools offer free trials, like Mish Guru and Minter.io (14 days). As of June 2022 we’re still on the hunt for a free tool that will store your Instagram Story data and allow for CSV exports. If you found a tool we should know about, leave a comment below.
Here’s to hoping Instagram builds this feature for desktop in 2022! 🤞
Use our Social Media Swipe File Airtable Template to build a gallery of good ideas and social media examples. To get you started, we’ve filled it with some of our favorite examples of great social posts — both paid and organic.
→ Click here to get it now.
read this next
Josh Krakauer is the CEO of Sculpt, that B2B social media agency you just discovered. Josh has launched social media campaigns for best-selling books, publicly-traded corporations, and early-stage startups. Josh works from Washington, DC, but still thinks Iowa City is the best city on earth.
Follow Josh:
Ready to grow? We're ready to go.
get a proposal
RBC Trends explain how to download all important information from Dropbox, Apple Notes and Facebook services in the face of their possible blocking
In recent days, Roskomnadzor has partially restricted access to Facebook, and Twitter was experiencing crashes. Other services where Russians store valuable information were also under threat. RBC Trends tells you how to save your data when blocking popular applications.
WhatsApp chats can be configured to be automatically copied daily and saved to your smartphone. If the user decides to uninstall WhatsApp, they will need to manually back up their chats. To do this, open WhatsApp, click "More Options", select "Settings" → "Chats" → "Backup Chats" → "Backup".
The export function can be used for both individual and group chats. To do this, open the chat, click "More options" → "More" → "Export chat".
Find the option "Export chat" in the drop-down menu in the upper right corner of the chat
In this case, the user must choose whether he will export media files. After that, he will receive an email with an attachment in the form of a document in TXT format containing the history of correspondence.
To receive a copy of all materials, you must send a download request in JSON format. To do this, you will need to enter your Instagram account password. The user must go to their profile, click on the icon in the upper right corner, select "Your activities", click "Download information". Then you will need to enter the email address to which Instagram will send the download link and click "Request File".
Instagram asks for an email to send the archive
When saving data, the user can choose what content he wants to download, as well as set the date range for downloading.
To download all data from Facebook, you need:
 The download request will then be set to "Pending" status and will appear under "Available Copies of Your Download Information Tool"
 .
Facebook allows you to select the format, quality and time range for saved files, as well as their categories
It may take up to several days for Facebook to prepare the archive. Then the user will receive a notification from the social network.
To download a copy of the requested data, you need:
To download files, the user can select either HTML or JSON file format.
The latter is more convenient for transferring data to another service.
To submit a request to upload an archive of tweets, the user needs to click the "More" icon in the navigation bar to go to the account settings. Then you need to select the item "Your account" in the menu, click "Upload an archive of your data", enter the password in the section "Upload an archive of your data" and click "Confirm".
The user will then receive a code to the account's stored phone number or email address. After confirming your identity, you need to click the "Request data" button. Twitter will send an email or push notification when the download is complete if the app is installed on the smartphone. After that, in the settings in the "Download data" section, you can click the "Download data" button. The archive is uploaded in ZIP, HTML, JSON formats. It may take several days to prepare.
Upload Your Data Archive button in the Twitter account dashboard demographic information, advertisement information, and so on.
You can transfer files and folders from your Dropbox account to your computer. To do this, you need to sign in to your account on dropbox.com, hover over the file or folder you want to download, then click "..." (ellipsis) and select "Download".
Download a folder with photos from Dropbox
This way you can download folders up to 20 GB in size, the number of files in which does not exceed 10,000.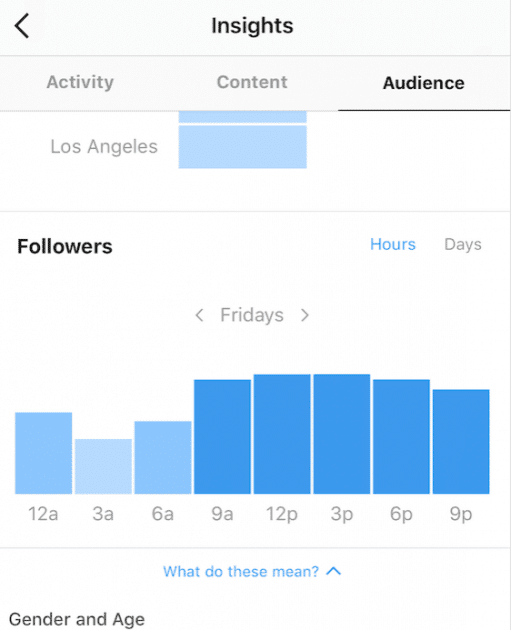 All folders are downloaded as ZIP archive files.
Dropbox Paper docs must be converted to one of the following formats to download to PC: DOCX, MD, or PDF. To do this, click "..." (ellipsis) in the document, select "Export", select the file format to download and click "Download".
The DOCX format will only be compatible with Microsoft Word, not Google Docs or OpenOffice.
Most users sync their notes with iCloud accounts. To upload notes from iCloud on Mac, you need to:
Windows users must first install the iCloud app on their computer and then sync their notes with Outlook. In the iCloud app, you need to:
Selecting notes to download in Backup Explorer (Photo: macroplant.com)
All iCloud notes will be available in the selected folder on the computer.
The export function can be found in the Board menu → More → Print and Export. The information is downloaded in JSON format. It is currently not possible to import the archive back to re-create a Trello board.
Export board from Trello
Trello Premium allows you to export all boards in your workspace in CSV and JSON formats. Also the user can include all their attachments as a ZIP file in their own format. To do this, go to the Premium Workspace page and select the Export tab.
To create an archive, you need to go to "Settings and members" at the top of the left sidebar, select "Settings" in the sidebar of this window, scroll down and click "Export all workspace content" (Export all workspace ). The user will then receive an email from Notion with a link to download the files. The link will expire after 7 days.
Export workspace from Notion
For Enterprise members, this option can be disabled at the administrator's discretion to keep documents available for internal use only. Enterprise plan users can export their workspace as PDF files.
You can upload individual images, HTML, Markdown, PDF and CSV tables on the service. To do this, click in the upper right menu "...", then - Export, and select the desired format.
Instagram account analytics service - LiveDune provides in-depth statistics of your profiles
Try for free02
Graphs help to understand how quickly followers are gained in the account: how many people were there a week ago, a month.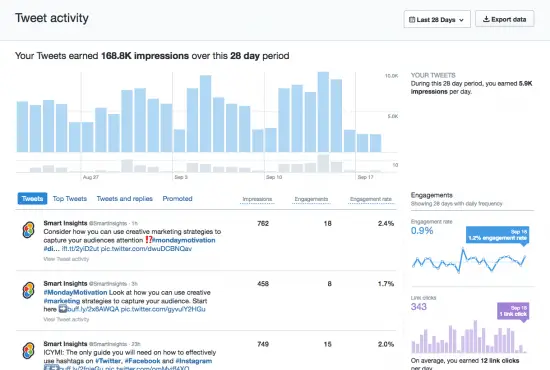 And the “Subscribed / unsubscribed” graph helps to understand how much the audience has updated over a certain period. Usually, if there was a lot of influx of a new audience, it makes sense to adapt the content for beginners.
03
In the LiveDune Instagram account analysis service, you can build top or anti-top posts using filters, sorting and combinations of indicators. Analyze content by ratings, categories, post type, likes, comments, saves, views, reach, engagement rates (RR, ER, ERR), etc. This will help you understand what content to post and answer the question “How to increase statistics on Instagram?”.
Try for free04
Check Instagram engagement using LiveDune can be evaluated using two metrics: ER and ERR. The higher the engagement rate, the more active audience you have. We will not only calculate the engagement for you, but compare it with other accounts by the number of followers and in the same category.
05
Detailed statistics of Instagram account subscribers with the ability to track changes over the analyzed period. For example, to see from which cities you have been subscribed more over the past month. Data can be viewed visually in graphs or uploaded to Excel.
Try for free06
It makes no sense to focus on generally accepted peaks (9:00, 12:30, 17:00, 21:00) when publishing posts, as it was with the chronological feed. But focusing on the time at which the largest number of account subscribers is active is the most correct. In the table, we will show when your followers are online and recommend hours for posting.
Try for free07
You can see the TOP hashtags, using which the posts got the most reactions (likes, comments, saves). Or find out which hashtags your competitors use the most so you don't have to manually collect data. Hashtags are collected both from the text of the post and from the comments under the post.
08
On average, compiling an SMM report takes 8 hours. In the LiveDune Instagram statistics tracking service, you can set up a weekly and monthly report in several formats (PDF, email, Excel, Google Slides) in 5 minutes. Spend the saved time searching for hypotheses and insights to work out in the next period.
Download example PDF report
Download sample Excel report
Opportunities
Analyze the effectiveness of your content strategy and monitor your competitors.
Hourly collection of statistics on your accounts or competitors' accounts for detailed analysis and search for growth points.
More
New
Operators, tags, notes, dialog statuses, statistics and other functions will help optimize your work with Direct.
More
Monitoring and processing of new comments, messages and mentions from social networks in one window, analysis of sentiment and response speed of managers.
More
New
Regular express audit of your Instagram account with clear conclusions and tips for promoting your account.
More
Export reports to PDF, Google Slides and Excel . We will also send weekly and monthly reports to your email.
More
Set KPIs for each account and track their progress in real time. You no longer need to calculate anything in Excel.
More
Schedule posts to all your accounts a month in advance in 5 minutes in one place. And we will publish the content, collect new comments and statistics on them.
More
Helps to select bloggers without markups and with good activity so as not to drain the budget.
More
FAQ
Post statistics, like other statistics, is available only on professional accounts: Business account or Author account. Read more about how to switch to a professional account in the article.
Reach is the number of people who have seen certain information in your account. It can be a post, stories, the blog itself or an advertisement. It only takes into account unique visitors, so repeated actions by the same person will not be counted. For example, if one person saw your post three times, that would count as 1 reach and 3 impressions. Impressions are always greater than reach.
After registration, add someone else's account to the Dashboard and view the statistics. On other people's accounts, statistics of posts, engagement and growth of subscribers will be available. Instagram profile analysis is available only for a Business account or an Author account.
To view Instagram account statistics online, register in LiveDune and add the account to the Dashboard. The first 7 days are free. Statistics are available only on professional accounts: Business account or Author account.
Engagement is the percentage of active audience from the total number of subscribers. You can get acquainted with all types of engagement indicators and the formulas by which they are calculated in the article.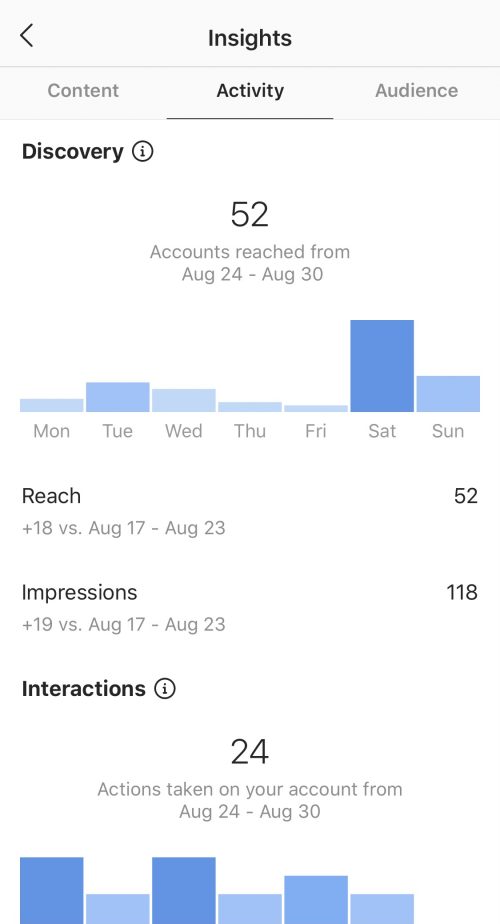
Sign up and add an Instagram account to the Dashboard. Next, open the Stories tab.
Only available for own accounts.
Sign up and add an Instagram account to the Dashboard. Next, open the Posts tab. At the end, you will find 3 graphs to analyze the performance of hashtags. Hashtag statistics analysis is only available for new posts.
Your accounts are safe because we work with social networks officially and do not ask for passwords.
There is a description for each graph and each figure - you can easily understand what this or that metric means.
Invite and set up access for colleagues to work on improving your accounts together.
Do you have your own internal systems? Great, you can pull data from us, from one place.
Reviews
This is my main social media reporting and analytics tool. I sincerely cannot imagine my life without a dashboard and uploads from Instagram profiles. Based on the data from the downloads, audits are built, work is underway on strategies and project supervision. In my opinion, today Livedune is the most effective tool for analytics of your own pages in social networks and a must-have tool for anyone involved in SMM.
Alexey Tkachuk
SMM strategist and blog creator Dnative. ru
ru
We use LiveDune to track our account statistics on a regular basis and to prepare reports. And based on the data received, we adjust the overall promotion strategy. We use the Dashboard as actively as possible (it’s convenient that there are post ratings and a section with data on advertising on Instagram has appeared) and the Comparison module. In general, we love LiveDune very much and are happy to test new features :)
Andrey Komissarov
Head of Communications Authentica and Shamelessly Talented
We have been working with LiveDune for two years now. All this time, the service is constantly evolving: managers respond to our requests and add new features that we need. We follow a couple of hundred accounts of our teams and divisions, players, so a qualitative comparison is required in various parameters. All of this is there and works great. It is also very convenient to keep track of all the KPIs of your VK and Instagram accounts: reach, engagement, views, popular posts.