When you’re gauging the effectiveness of your Instagram campaign, it can be difficult to figure out which analytic measures are most meaningful.
For example, what’s the difference between Instagram reach vs impressions?
No matter how successful your campaign, you’ll usually notice your impressions are higher. Impressions refer to the total number of times a post or story is viewed, while your reach refers to the number of unique viewers.
Want to better understand these instagram metrics and the best ways to maximize your impact on Instagram? This is our guide to one facet of Instagram management.
Business and creator accounts can view analytic insights from the Instagram app. While insights aren’t yet available for newer features like Instagram Reels, you can crunch the numbers on:
To measure the success of your various kinds of posts, take advantage of Instagram data in the following categories:
Which of these metrics is the most important?
In short, all three help you understand how well your campaign is performing. The best place to focus your attention depends on your ultimate goals.
Next, we’ll take a deeper dive into each important metric and the ways you can boost your numbers.
When it comes to Instagram marketing, reach is the name of the game. The social media giant has a base of 1.16 billion users.1 In the U.S., 63% of those users visit the app on a daily basis.
While different campaigns have different CTAs, awareness is always an important goal and metric. And reach is one valuable potential tool to measure your success in creating brand awareness.
As we explained, your reach refers to the number of people who scroll past a piece of content—but it’s possible to get eyeballs beyond your Instagram followers’. How?
 m. might not help you connect with your target audience (unless you’re targeting users in another time zone or insomniacs).
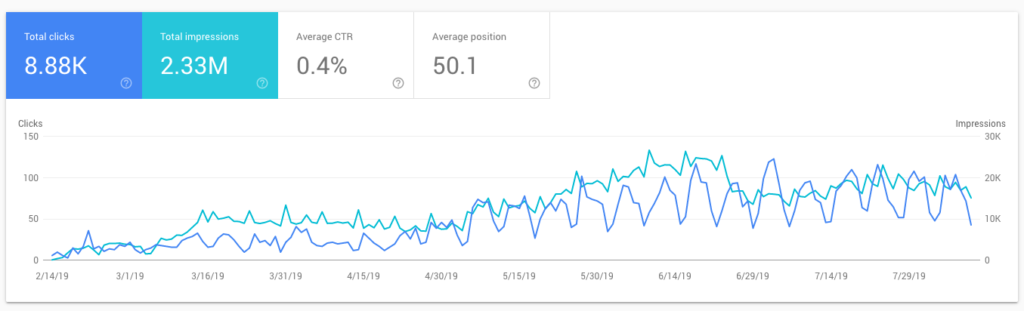
When it comes to Instagram reach vs Instagram impression, which is more meaningful?
While it’s important to grow your reach by exposing more users to your posts and ads, you want to make sure they’re actually paying attention.
This is where impressions come into play.
If your reach and your impression numbers are similar, it could pose a problem.
Why is that?
Well, consider the number of times you’ve scrolled past an ad on Instagram without taking the time to read the caption—much less like, comment, or investigate the brand.
Your impressions refer to your total number of views (including by users who returned to a post twice or ten times). If someone’s interested, there’s a higher likelihood they’ll return to your post again and again.
Therefore, impressions are an even better measure of your campaigns’ success in generating awareness. Likewise, they can be used to gauge the stickiness of your posts.
To boost your impressions, try out the following strategies:
 The only way to figure out which posts generate the most impressions is to dabble in each genre.
It’s great if someone views your content more than once—but keep in mind that the ultimate goal is for the user to take action.
More engagement signals the Instagram algorithm that your post is worth promoting in the newsfeed or on “Discover.”
If you partner with an influencer, one of the first questions you’ll want to ask is how much engagement they receive.
There are several ways to calculate your engagement rate:
 if 33 of your 1,000 followers liked or commented on your post, your engagement rate is 3.3%.
You can also use third-party tools to track this information without the help of a calculator.
Keeping track of individual posts’ engagement can help you understand what motivates users to go the extra mile and comment or like. You can use this information to adjust your marketing strategy, striving toward an uptick in your 30-day engagement rate over time.
As noted above, the Instagram Analytics tool also enables you to track your profile’s performance, including the number of website clicks.
Likewise, you can view your website referral traffic using Google Analytics or another tool of your choice.
While this data may not directly correlate to a specific post, it’s straightforward to cross-reference clicks with the timing of recent posts and stories.
Website clicks are an important step in the sales funnel, so identifying successful posting strategies is key in converting clients.
Different campaigns have different goals. While awareness helps capture users at the top of your funnel, Instagram can also help drive more viewers down to conversion. In fact, Instagram Shopping can help them convert without leaving the app (depending on your checkout experience).
When you are in the process of learning how to set up instagram shopping, you’ll unlock new tools.
 Otherwise, you can redirect them to your website (or your DMs).
Between mastering Instagram’s ever-multiplying features and keeping track of KPIs using native and third-party tools, it’s more complex than ever to grow your success on Instagram.
Tired of experimenting with posts, videos, and reels?
At Power Digital, we understand the importance of a holistic marketing strategy—and the key role that Instagram can play within it. We’re Instagram experts, which means we can increase your impressions and your ROI.
Get in touch today to learn how we can help your business grow.
Sources:
 The State Of Influencer Marketing 2020. https://blog.fohr.co/post/the-state-of-influencer-marketing-2020?rq=hashtags
With so many social networks on the scene and even more metrics to keep track of, it can be difficult to make sense of your data. One thing we know for sure: you should be investing in Instagram and Instagram Stories strategies.
Not convinced?
Instagram provides the perfect platform for you to share a variety of photo or video content and interact with your audience in new ways.
Among some of the highlights covered in our round up of key Instagram stats for marketers are:
Now that you’re familiar with some of the reasons Instagram is integral to your social media marketing strategy, read on as we break down the primary Instagram metrics and definitions you need to know so you can go forth and analyze with confidence.
Pinpoint Instagram success with Sprout Social
Sprout’s comprehensive Instagram features can help you get a handle on your social success.
Break down what’s working and what’s not through our message- and channel- level reporting, and schedule out your content calendar in advance.
Try out these features and more with a 30-day free trial see how Sprout can streamline your Instagram efforts.
Instagram Reach: The number of unique users that saw your Instagram post or story on any given day
Unless you’re putting some serious spend behind your Instagram posts, you probably won’t have every single one of your followers see your content. And even with some serious spend, it’s unlikely that you’ll reach all of your followers. That’s why your Instagram reach is important. Reach tells you how many unique users are served your content every day. Try to maximize this metric to increase brand awareness.
Instagram Impressions: The number of times your content, whether a post or a story, was shown to users.
While commonly confused with reach, impressions are the total number of times your content could have been seen. If your Instagram impressions are higher than your reach, it’s a sign that your audience is viewing your content multiple times. Look for posts with a high impressions-to-reach ratio for an indicator of what’s performing well.
Instagram Engagement Rate: This is your post engagement divided by post impressions.
Engagement rate is a must-track metric for social marketers. Engagement rate is an indicator of how engaged the users who saw your posts were. Break down your Instagram engagement rate by media type to understand if your audience is more likely to engage with photo posts, video posts, or carousel posts.
Over time, engagement rate can tell you how one campaign or messaging strategy performs vs. another campaign or messaging strategy. It’s a great metric to track as you test new approaches.
Instagram Saved Posts: The number of users who saved your posts.
As the name implies, saved posts gives users the option to save a post to reference at a later time in the Saved section of their profile. Saves are great for extending the life of your Instagram posts, as users revisit saved content months after it was originally posted.
Instagram Stories have been a great addition to the social marketers’ arsenal of content weapons, most notably for the different ways it allows you to engage. Along with that comes Story-specific terminology pertaining to key metrics you’ll want to make sure you’re keeping tabs on.
Taps Backward: The number of times your audience tapped back to go to a previous story.
This may mean that your content was engaging enough that the user wanted to see it again. However, it could also be a sign that any copy you’ve included in your story is too long to read in the time given. Look through stories with a large number of taps back to ensure there’s not too much copy.
Taps Forward: The number of times your audience tapped forward to go to the next story.
This can be an indicator of your story not resonating with your audience or being too lengthy, if it’s a video. Review the stories with the most number of taps forward to identify common themes, like length, copy, or content.
Replies: The number of times a user swipes up on a story and replies to you.
Replies can be a goldmine! Users who reply to stories may be passionate about your brand and have great feedback to share. Replies will begin a DM conversation between you and the user, so it’s a great time to engage with your audience.
Exits: The number of times a user swipes down to exit out of story mode and go back to the previous screen.
An exit means a user has decided not to make it all the way through your Stories. You’ll want to keep this number low.
That about wraps up the core terminology you’ll want to know as you evaluate your Instagram performance and strategy, but there’s still plenty more fun ahead!
Dive deeper into Instagram analytics and keep all your metrics in check with the help of Sprout. If you haven’t yet given us a try – you can request a personalized demo or get started with a 30-day free trial today.
Hello everyone! My name is Vika, I have been working as an Influence Manager for about 4 years (even before it became mainstream). During this time, I have gathered enough experience and knowledge, and I want to share with you useful information that can help when working with bloggers.
128 893 views
There are a huge number of services that analyze bloggers for cheating, etc. But in my opinion, it is still worth first of all to independently evaluate the account: it will be even more reliable + it will not require additional financial costs. Where to begin?
Previously, the only numbers you saw were the number of followers, likes and comments. Now it's easy to find out how many subscribers are watching posts, where they live and their age. Let's look at specific examples of what statistics to request from a blogger, and how to analyze it, I will write in the next article :)
Note: the article was written for those who are just starting to work with influencers. And, of course, statistics do not show the real picture completely. Learn and try!
I just want to post: ask for publication statistics
The number of subscribers is one thing. But how many of them really see the publications of the blogger will help to find out the statistics. Under each publication there is a button “View statistics”, where detailed information is hidden.
The second important thing is where people saw the post from.
In addition, post data can be viewed in the general account statistics. Here you will see information about each individual post and see the big picture, which looks like this:
@ekkkaty statistics from the @ekkkaty.pr public account0004
As a rule, all posts from the last year are opened first, arranged by coverage - from largest to smallest, but you can set filters:
Content type: all/photos/videos/carousel posts/product posts Note: if you want to post not a standard photo post, but a video or gallery, then just ask to send statistics by setting a filter for this type of content.
Metrics (regular posts): engagement/calls/site clicks/comments/likes/reach/followers/impressions/get directions/profile visits/shares/saved/profile visits/shares/saved/emails/ SMS
Deadline: 7 days/30 days/3 months/6 months/1 year/2 years
Where to view data: general statistics → content → publications
How about just Stories? Yes, they say it's cheaper.
Stories posts are loved for two reasons: they are usually really cheaper than a post in the feed and often have a better effect than a post.
History statistics can be viewed in two places: under the history itself and in general statistics, which is much more convenient.
In general statistics, possible search filters:
Timeframe: 24 hours/7 days/14 days
Metric: forwards/calls/outs/site clicks/link clicks/back/responses/reach/subscribers/ Impressions/Get directions/Profile visits/Shares/Next story/Emails/SMS
The most important of these indicators are:
Where to see the data: general statistics → content → stories
We need a blogger with subscribers from St. Petersburg: we request statistics by city
In the general statistics there is a section “best places”, where the cities and countries in which the majority of subscribers are located are shown in the form of a diagram.
Note: please note that the data is not taken from Instagram pages, but from Facebook. Due to the fact that not all followers link their Instagram accounts to Facebook, the statistics may not be entirely accurate.
Where to see the data: general statistics → audience
Product for girls over 18: requesting statistics by sex and age
In addition to the city and country, you can see the ratio of men and women in the blogger's account, as well as the main age of the audience.
In the example, we see that most of the subscribers are women over 18. Take it!
Where to see the data: general statistics → audience
When to publish a post: request statistics on subscribers
I would like to note that bloggers themselves know what day and time their audience is active, and in this matter you can listen to their opinion, but if you need additional safety net, then Instagram internal statistics will help you here too.
There are two types of data to choose from: activity by day and by hour. Sounds great, right? But there is a big nuance: they say that the blogger's subscribers are active after his post, and if each post is made at a certain time, then it will be top on this chart. Is this statistic correct? Is not a fact. But I know one thing for sure: if the blogger and the post is cool, then no matter what time (reasonable) you publish, he will come.
Where to see the data: general statistics → audience → subscribers
Statistics and subscribers can be tweaked? Yes! Photoshop? Yes! Don't blindly rely on it. See comments, likes, texts, numbers and you will be happy :)
Hint: ask the blogger to record the screen when he opens the stat. This will greatly reduce the risk of fraud.
Vika, Influence Manager
Telegram
Home
Blog
What is reach on Instagram and how to increase it
Gone are the days when the fight was for followers, it's time to fight for reach. The greater the reach on Instagram, the more fans on your blog, potential buyers or advertisers. Let's figure out how to view coverage, analyze it correctly and increase it.
How reach differs from impressions on Instagram
How to see reach on Instagram
What depends on the coverage on Instagram
How to increase coverage
How to increase coverage
FAQ
What is the difference from impressions on Instagram
To begin with, we’ll figure it out, which means coverage of static statistics on Instagram and how it differs from shows.
(reach) is the actual number of people who have seen certain information in your account. This can be a post, stories, the account itself, or an advertisement. It only takes into account unique visitors, so repeated actions by the same person will not be counted.
Impressions /Views (impressions) is the total number of views of your post/stories/account. That is, one user can view the same post / stories several times or log into the account.
For example, if one person has seen your post three times, this will count as 1 post reach and 3 impressions. Impressions are always greater than reach.
How to see the reach on Instagram
You can view the reach of your account, posts and stories in the internal statistics of the Instagram application, but only for 30 days. This is not enough to evaluate the growth of an account in dynamics and find weaknesses that pull the reach down.
To get extended coverage statistics and compare indicators from month to month (retrospective from 1 to 5 years), add it to monitoring in LiveDune. Next, go to the "Coverage" tab and select the desired period for analysis using the calendar in the upper right corner. A breakdown of each metric with examples can be found here.
What determines the coverage on Instagram
Due to the algorithmic feed, only those subscribers who interact with your content or account see your posts: read posts (spend a few seconds on the post, scroll through the carousel), watch videos or IGTV , like / comment / save / repost, write to you in Direct, watch and reply to stories, go to the profile. At the same time, the interaction should be repeated - Instagram takes into account the historical interactions of one account with another. Therefore, in order for subscribers to leave reactions to posts and stories more often, the content should meet their interests or touch on relevant topics. It is also important to periodically apply game mechanics and polls in stories.
Post length, post time, and geolocation are additional ranking factors. And if the publication is liked by a large number of subscribers, then it is most likely to be shown to other less active subscribers.
There is also a chance to get into the recommendations, here the algorithm looks at your interests by topic, as well as how popular the post seems to be - how quickly the post collects likes, comments, reposts and saves.
How to increase coverage
The main secret of high reach is constant analysis. This allows you to understand what topics, formats subscribers respond better to, and what they leave unattended.
Explore the top posts by reach. Analyze the posts and try to understand how they differ from others. For example, in a post you raised a hot topic for subscribers and at the end asked for the opinion of subscribers, thanks to which you received a lot of comments. Or they published beautiful photos of attractions, and in the text they described how to get to them, and the post received a lot of likes and saves.
Then analyze which posts got the least exposure. This will create a complete picture of which posts should be excluded from the content plan, and which ones, on the contrary, respond better to subscribers and can be published more often. You can view the top posts in the table on the "Posts" tab in LiveDune, to do this, click on the icon with coverage in the table once (down arrow).
Experiment with post formats. Try posting more carousels and videos rather than just images. Carousels, first of all, are good because they are shown in the feed as many times as there are slides in it (for example, 4 slides - 4 times the carousel can appear in the subscriber's feed). And the subscriber spends more time watching a video than a regular post with an image, which gives a chance to increase the desired reach.
You can evaluate which post format the audience responds to best on the “Posts” tab ― the “Post Types” graph. Similarly, analyze the posts of competitors, see which format suits the audience better. But be sure to pay attention to the topic and visual of the posts, as well. the secret of success may be in them, not in the format.
Post when your followers are online. Analyze when most of your followers are online and adjust your posting times to increase your reach. To do this, on the "Audience" tab, study the "Online Followers" graph. Inside the squares will show the number of subscribers who are online on a specific day of the week and hour. The recommended hours for posting are marked in pink, in which the chances of increasing coverage increase.
How to increase your reach is not possible
In an attempt to increase your reach, many people start posting more often.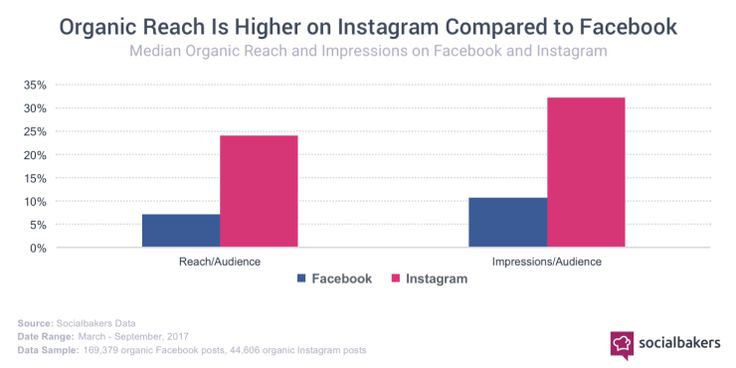 This method, although it works, is short-term, because increased posting usually entails a decrease in the quality of content and rapid burnout. It is more correct to increase coverage by improving the quality of content. Then subscribers will respond better to posts (like, comment, save), and raise the algorithmic feed in the search results, so the coverage will quickly grow.
You can see the average reach of a post on the Reach graph. Hovering over the desired month will display the average reach of the post. And the blue dotted line will show the dynamics of the “Average Post Reach”.
Each user is counted in the weekly coverage once, while he could watch your posts every day. Therefore, in the sum of coverage for seven days, the user could count up to seven times. The situation is similar with the monthly coverage.
Daily reach means that N users were reached on D-day. And post reach on D day means the sum of the reach of all posts published on D day.
It is incorrect to compare these metrics, because the coverage of the account for the past dates does not change, because new users are counted in today's coverage. But the amount of coverage of posts published over the past date may increase due to new users.
"D-Day" can be changed to any period.
Only important news in the monthly newsletter
By clicking on the button, you agree to the processing of personal data.
What's new in SMM?
Subscribe now and get an Instagram account audit guide
Popular articles
≈ 10 min to read 02/08/2022
What Instagram trends will be popular in 2022
What to pay attention to in order to be in trend: design, visual and content, and what is better to refuse.
≈ 12 min to read 11/11/2021
Instagram account audit using LiveDune
An Instagram account audit will help you prepare or adjust your content strategy, find insights, and correct mistakes.
#instagram 08/23/2019
How to increase your reach with alt text on Instagram
Let's talk about alt text on Instagram and how to use it to increase your reach.