Any successful strategy requires four components: goal-setting, implementation, analysis and refinement. Instagram analytics address the analysis portion of this equation for social marketers.
Good Instagram analytics tools help you understand how your Instagram efforts are paying off. You can learn what’s working and what’s not. Then you move onto the refinement portion of the strategy, tweaking your efforts to boost your results and improve ROI.
Let’s look at some of the best Instagram analytics app options, and the most important Instagram metrics you need to track.
Instagram analytics tools
How to see your Instagram analytics
How to access Instagram analytics on desktop
Important Instagram metrics to track
Bonus: Get a free social media analytics report template that shows you the most important metrics to track for each network.
If you’re using an Instagram Business or Creator account, you have access to this built-in Instagram analytics app.
(If you’re still using a personal account, check out our step-by-step instructions to switch over to an Instagram Business account now.)
This native analytics tool within the Instagram app provides insights into your account performance, including reach, engagement, followers, and Instagram ads. We’ll show you exactly how to see Instagram analytics using Insights later in this post.
Insights is a great Instagram analytics free tool, but it may not be the best Instagram analytics app for serious social marketers. For more robust, longer-term tracking, or to export your data for a social media report, you’ll need to look at other Instagram analytics tools.
2. Hootsuite AnalyticsHootsuite Analytics allows you to track Instagram analytics in more detail than the native Instagram Insights.
Source: Hootsuite
Sure, we may be biased, but for the record, here are some things that the Hootsuite Analytics dashboard can do that Instagram can’t:
See how all your posts are performing in one place. Grow your business faster with Hootsuite’s social media analytics.
Free 30-Day Trial (risk-free!)
3. Hootsuite Impact
If you need an even more detailed overview of your performance, this tool is for you. Hootsuite Impact allows you to compare metrics for different social accounts side by side. It also provides detailed ROI analysis for both organic and paid Instagram activity.
Remember how we said right up at the top that refining your strategy is a key part of using analytics to improve? Hootsuite Impact can provide custom recommendations for refining your strategy based on your specific goals.
Hootsuite Impact is available for all Hootsuite Business and Enterprise plan users. Book a demo here.
4. Creator StudioThis is another native Instagram business analytics tool. However, instead of being built into the mobile Instagram app, Creator Studio works on your computer.
Creator Studio gives you access to most of the same metrics as Instagram Insights, but only for a seven-day window.
Source: Creator Studio
One neat analytics feature of Creator Studio is the Calendar view, where you can see at a glance exactly when you posted to Instagram.
If you’re a member of Brand Collabs Manager, you can also track your brand collaboration metrics here in Creator Studio. We’ve got a full blog post on how to use Creator Studio that walks you through all the ways you can use it with your Instagram Business or Creator account.
5. IconosquareStart with Iconosquare’s Instagram audit for business accounts. This Instagram analytics free tool provides data on your reach, engagement, likes, saves and more. It also provides information on how your Instagram metrics stack up against the average rates on the platform.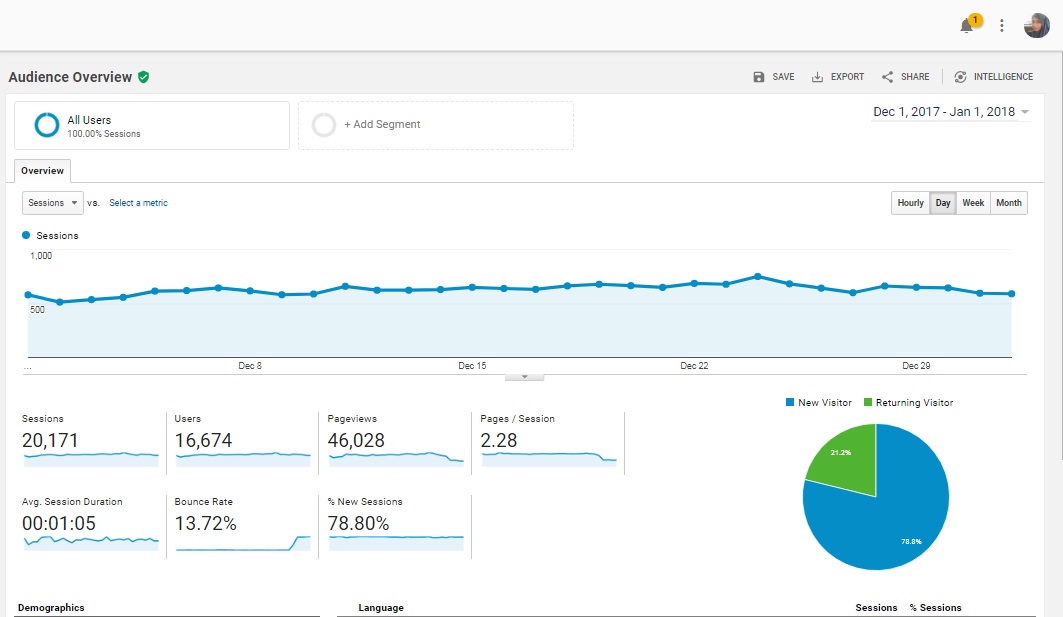
Source: Iconosquare
Iconosquare also offers a free trial of their pro dashboard. You’ll get all the standard metrics: engagement rates, follower stats, Stories data, et cetera.
6. KeyholeKeyhole specializes in Instagram hashtag analytics and keyword tracking, along with all the usual Instagram metrics.
Source: Keyhole
It can be used to measure how branded hashtags perform, and track promotions, user-generated content and Instagram contests in real-time. It’s also a useful tool to track Instagram analytics when you work with influencers.
7. PhlanxPhlanx offers a free, easy-to-use Instagram engagement calculator. The handy thing is you can use it to check your own account, or someone else’s. That means you can use it to pre-screen potential influencers and brand ambassadors.
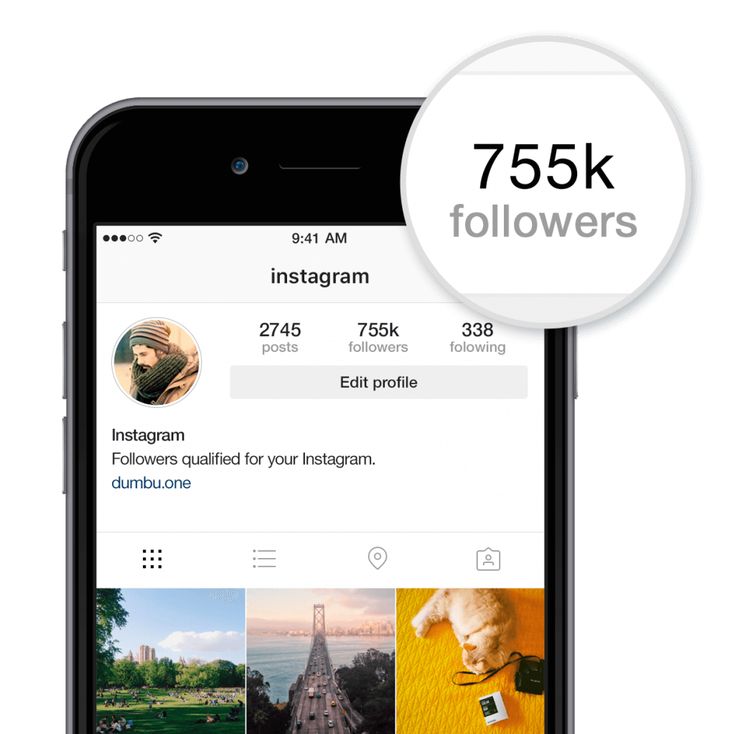
All you have to do is type in any Instagram handle to see total followers, engagement rate, and average likes and comments per post.
Source: Phlanx
8. Facebook Ads ManagerIf you’re running paid campaigns on Instagram, Facebook Ads Manager is a key resource in your analytics toolbox. It provides performance and cost information for all the ads you place on the Facebook family of products, including Instagram.
You can get performance information for your Instagram promotions within Instagram Insights, but to perform a thorough cost analysis, you’ll want to incorporate Ads Manager as well.
How to see your Instagram analyticsHere’s where to find all your Instagram metrics within the Instagram app. (Remember that you need a Business or Creator profile to access analytics.)
Instagram account analytics
Source: Instagram
In the top menu, you can choose whether to view these Instagram metrics for the last 7 or last 30 days.
Instagram followers analyticsFrom the overview screen, scroll down to Your Audience and click See All. You’ll see an overview of your follower growth, followed by details on your audience demographics.
You’ll find loads of useful information on this screen, including your audience’s:
In addition to tracking your follower growth metrics, this is valuable data for planning when to post on Instagram as well as guiding your content strategy.
Instagram post analyticsFrom the overview analytics screen, scroll down to Content You Shared, then click the right arrow next to your number of posts.
This will bring up a listing of all your posts, sorted by the metric you choose. The default is reach, but you can choose from a long list of metrics, including comments, follows, shares, and more.
Bonus: Get a free social media analytics report template that shows you the most important metrics to track for each network.
Get the free template now!
You can choose timeframes from 7 days up to 2 years, and filter by post type (photos, videos, carousel posts, or all posts).
You can also find the analytics for any individual Instagram post by clicking the View Insights link under the post in your feed.
Source: Instagram
This will bring up a little pop-up box showing the total likes, comments, saves, direct message shares, profile visits and reach.
Source: Instagram
Instagram Stories analyticsFrom the overview analytics screen, scroll down to Content You Shared, then click the right arrow next to your number of Stories.![]()
Just like for your posts, you can see reach, impressions, and so on. You can also see exits, forwards, and other Stories-specific metrics. You can view a time range from 7 to 30 days.
Source: Instagram
For more details, we’ve got a whole blog post to help you make the most of your Instagram Stories analytics.
Instagram Reels analyticsAs of May 2021, Reels analytics are included in the Reach breakdown in Instagram Insights. To access it, tap the right arrow next to Accounts Reached in the overview screen.
Here, you will see how your Instagram Reels performed compared to other content types over the last 7 or 30 days. This section also includes a ranking of your top Reels.
Source: Instagram
To view insights specific to Reels only, scroll down to Reels in the Insights overview screen and tap the right arrow next to your number of Reels.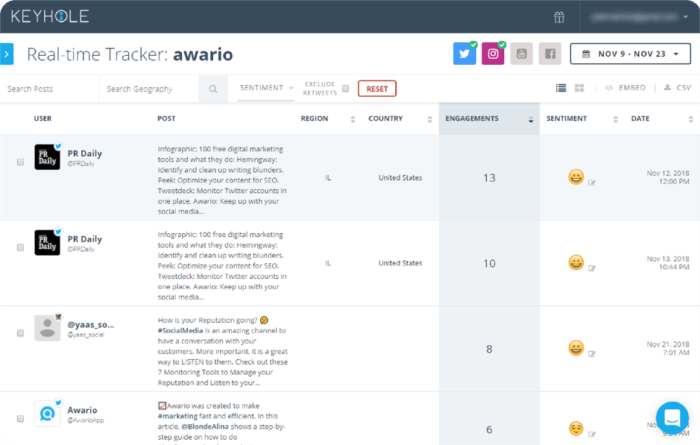 Here, you can see all of your Reels performance metrics in one place.
To check in on the performance of a specific Reel, open the Reel from your profile, then tap the three dot icon in the bottom right of the screen, then tap Insights.
Source: Instagram
For more information, check out our guide to using Reels Insights to make better content.
Instagram Live analyticsThe May 2021 Instagram update also brought Live analytics to Insights.
To access Live Insights, go to the overview analytics screen, scroll down to Live and click the right arrow next to your number of streams. Here, you will see metrics related to Live streams: accounts reached, peak concurrent viewers, comments and shares.
Source: Instagram
How to access Instagram analytics on desktopNavigating through analytics on your phone is great for quick, on-the-go tracking of your Instagram metrics, but it’s not the greatest when you’re trying to analyze your data or create a social media report.
Fortunately, you can also access your analytics on your computer using an Instagram tool for desktop like Hootsuite Analytics and Hootsuite Impact.
1. Go to your Hootsuite dashboard, and click the Analytics icon in the sidebar.
2. Select your Instagram Overview (if you haven’t already, follow these steps to connect your account)
Select your date range, review your metrics, and schedule any reports you need.
Important Instagram metrics to trackFeeling a little overwhelmed? With so much information available, it can be tough to figure out which data points really matter for your brand.
Here, we break down which Instagram metrics you should track to reach the goals that matter to you.
Account metricsEngagement rateHow to calculate engagement rate:
Average across all posts: [Post interactions ÷ total follower count (or impressions) ✕ 100]
This metric is a baseline for evaluating how well your content is resonating with your audience and inspiring action. Note that this percentage will often dip as you gain more followers.
Almost all analytics tools will calculate this number for your account, as well as for each post.
Because some experts think the number of impressions is a better comparison than follower count, you might get a different percentage from different calculators.
Pro tip: If you want to get granular, here’s a breakdown of all the different ways to calculate engagement rate.
Follower growth rateHow to calculate follower growth rate:
Number of followers gained ÷ previous number of followers ✕ 100
If you don’t track growth over time, your follower count is pretty much just a vanity metric. That’s a wasted opportunity, because no other Instagram metric has a bigger impact on organic reach.
(If one of your goals is increasing brand awareness, check out our tips for getting more Instagram followers.)
Website referral trafficThe number of people who visit your website from Instagram.
Monitoring the flow of traffic from Instagram to your website is key if you want to increase your Instagram ROI.
There are three main ways to measure website traffic from Instagram:
Pro tip: If tracing customer movement along the buying journey sounds great, but complicated, we recommend you take a look at Hootsuite Impact.
Individual post metricsPost engagement rateHow to calculate post engagement rate:
Post interactions / total follower count (or impressions) ✕ 100
Engagements (likes, comments, and saves) show that you’re connecting with followers on Instagram. Some social media experts prioritize comments over likes because they take more effort and may indicate a higher level of interest.
How to calculate post comment rate:
Post comments ÷ total follower count (or impressions) ✕ 100
A like is fairly easy to dish out, whereas you’ll want to pay attention to the people who take the step to leave a comment on your post.
If your goals involve building loyalty, or nurturing relationships, count comments separately from overall engagements, and work to lift that number specifically.
Pro Tip: Cross-reference comment counts against message sentiment in your social listening tool to check not just whether your content is resonating, but how.
ImpressionsThe total number of times your post was served to Instagram users.
The number of impressions a post earns can indicate how well you’re promoting your account and content.
Are you choosing the right hashtags? Cross-promoting effectively? Have you considered promoting your posts with some ad spend?
Keep an eye on this number. Especially if your goal is building awareness at the top of the sales funnel.
The total number of unique accounts who saw your post.
Your organic reach is related to the number of followers you have, but that’s not the whole story. It’s also related to how interesting your content is.
The more engaging your content is, the more people will see it. That’s why it’s key to understand how the Instagram algorithm works.
Instagram Stories metricsStories engagementHow to calculate Stories engagement:
Total actions ÷ Total reach X 100
To measure engagement on your Stories, add up the replies, profile visits and sticker taps earned. These positive interactions can tell you what you’re doing right.
For a full rundown of Instagram Stories analytics, check out our guide.
Completion rateHow to calculate Stories completion rate:
Number of people who viewed the final Story segment ÷ Number of people who viewed the first Story segment X 100.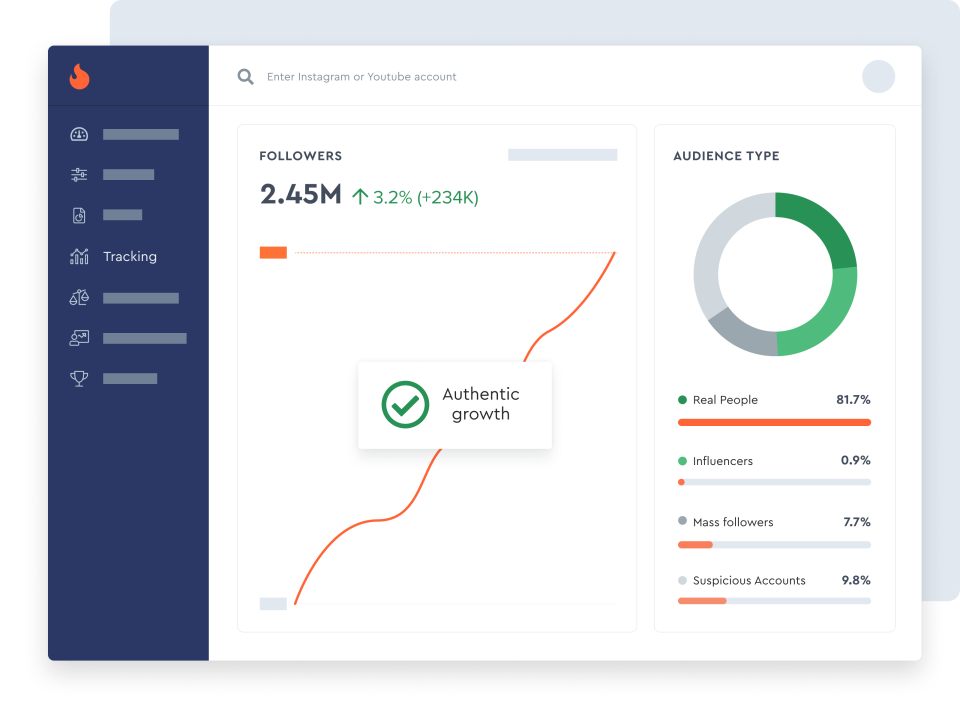
People watching your Story all the way through indicates your content is connecting with your fans.
It’s also a good idea to keep an eye on all the navigational metrics for potentially negative feedback:
This is great feedback for those who don’t mind a little tough love. Use this information to up your game on Instagram Stories.
Reels metricsReel engagement rateHow to calculate Reel engagement rate:
Reel interactions ÷ total follower count (or views) ✕ 100
Add up the total Reel likes, comments, shares and saves, then compare that to either your follower count or the number of viewers for the Reel.
Using your follower count in this figure will give you a sense of how compelling your Reels are for your overall audience, while using the number of viewers will give you a better idea of how Reels perform against one another.![]()
How to calculate Live engagement rate:
Live interactions ÷ total follower count (or accounts reached) ✕ 100
Add up the total Live comments and shares, then compare that to either your follower count or the number of accounts that Live stream reached.
Instagram Ads metricsClick-through rateHow to calculate ad click-through rate:
Clicks ÷ Impressions X 100
Click-through rate is an important metric to track, but remember that a higher rate is not always what you’re looking for. If you’re paying for each click, you want to make sure your ad copy properly qualifies potential buyers so only those who are actually interested in your brand click through.
ConversionsFor many brands in ecommerce and B2B, this number is the ultimate goal. You want to sell your product, sign up a new lead, or get an email address.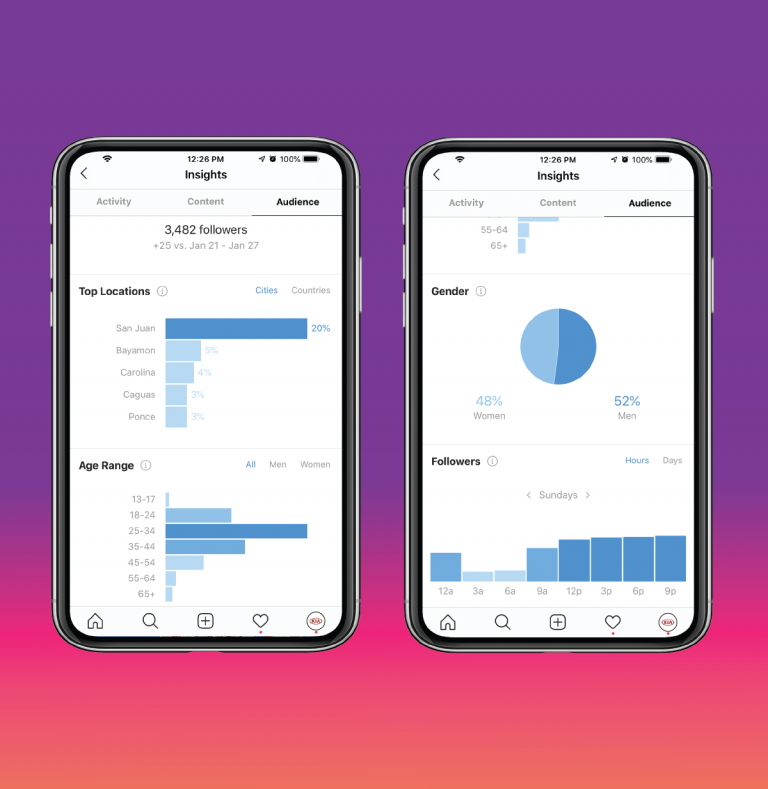
You can track these tangible results using Hootsuite Impact.
Cost per resultHow to calculate cost per result:
Total amount spent ÷ number of results (for a specified time period)
How much did each of those conversions cost you? Keep an eye on this number to make sure you don’t pay more for a conversion than it’s worth. You can find this data in Facebook Ads Manager.
Save time managing your Instagram presence with Hootsuite: Schedule posts and Stories ahead of time, and monitor your efforts using our comprehensive suite of social media analytics tools. Try it free today.
Get Started
Easily track Instagram analytics and generate reports with Hootsuite. Save time and get results.
Try it for Free
If you want to grow your Instagram account, taking a look at your Instagram analytics (also known as "Insights") is a great place to start.
Instagram analytics can help you target the right audience, improve your content strategy, and reach new audiences.
But learning all of the different Instagram metrics and terms, and how to use this data for growth, is no mean feat.
In our Ultimate Guide to Instagram Analytics, we’ll walk through what each metric means, and how you can use this knowledge to build a winning content strategy.
Why Instagram Analytics MatterInstagram analytics are the best way to understand who your audience is, when they’re most active, and what type of content they engage with the most.
This level of insight is hugely important for creating a content strategy that drives results for your brand or business — without it, you’re essentially working in the dark.
However, finding the right metrics to track, as well as knowing how to interpret them, can be easier said than done.
Every brand or business has its own unique goals (from growing a follower count to increasing clicks and conversions) which means that the most important metrics differ on a case-by-case basis.
Once you’ve clarified your goals, you’ll be able to get so much more from your Instagram Analytics — as you’ll have clear objectives to monitor in your social media reporting.
Discover how to use Later's Instagram Analytics tools to fuel your growth in this quick video tutorial:
How to Access Instagram InsightsInstagram Insights (Instagram's in-app analytics) are only available to business or creator profiles, which is just one of the many reasons we recommend switching to an Instagram business or creator profile.
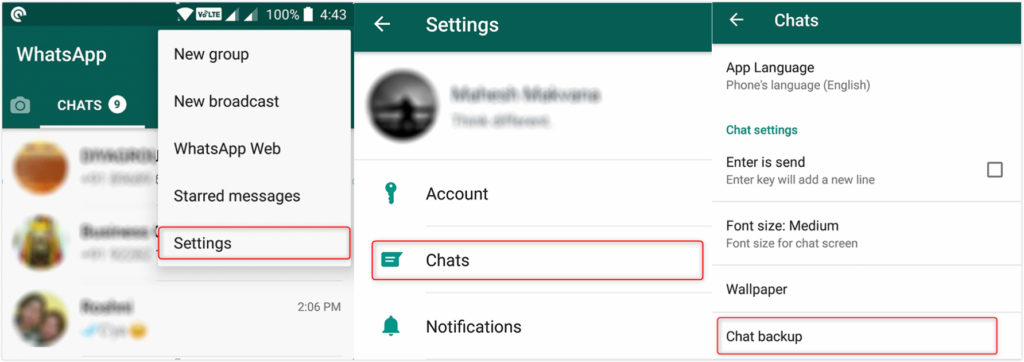
Once you have an Instagram business or creator profile, you can easily access your analytics through the Insights tab in the Instagram app.
Start by tapping on the menu icon in the top right corner of your profile, and then click on Insights tab, which will open the analytics for your business or creator profile. Alternately, you can tap the Insights button on your profile page.
Once you open your Insights, you’ll be able to find a ton of metrics and analytics for your posts, stories, and audience demographics.
NOTE: Instagram can only show you analytics for posts and stories that were published after you switched to a business or creator profile.
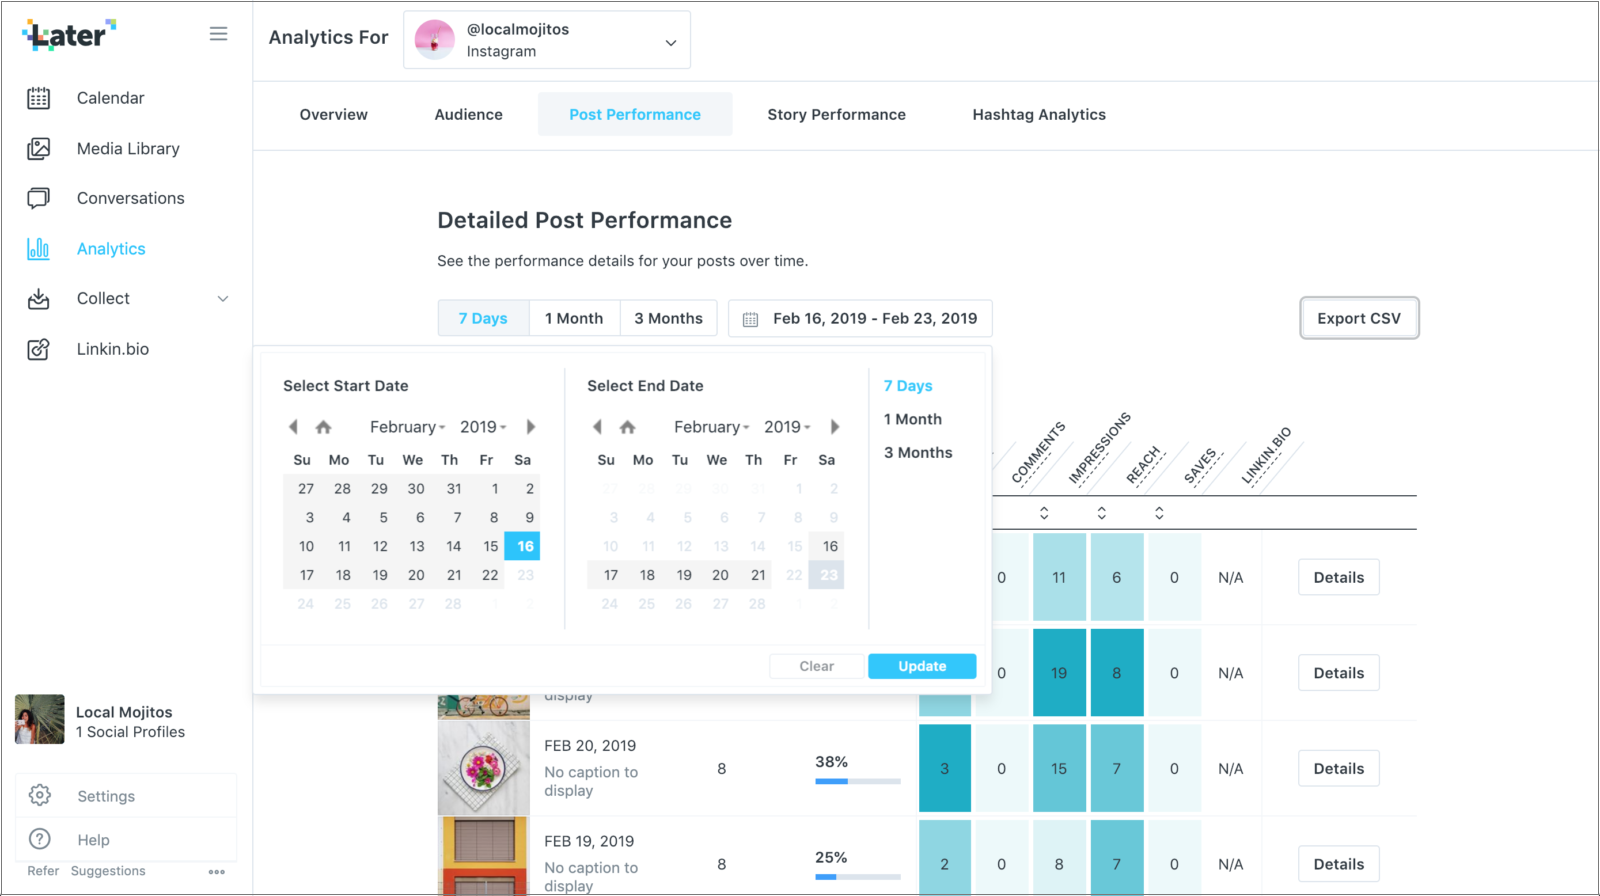
How to Access Analytics With Later’s Analytics DashboardAlongside Instagram’s native analytics, Later’s Instagram Analytics feature gives you a visual overview of how your posts and stories are performing – all in an easy-to-use dashboard.
You’ll find all of the must-have analytics from Instagram in a digestible format, as well as several extra data points — including your best time to post (available on Growth and Advanced plans).
You can track up to 12 months worth of Instagram feed posts and stories, so you can see which have performed best — and filter by all the key metrics, such as likes, reach, comments, and more.
Plus, Later’s Instagram Analytics have separate “Post Performance” and “Story Performance” dashboards — so you can see exactly how each channel is driving value for your brand.
Ready to start tracking your performance more efficiently? Sign up to Later and explore the Instagram Analytics dashboard today — now available for both Instagram business and creator accounts.
Part #1: How to Use Instagram Audience AnalyticsGetting to grips with your audience analytics is a great way to understand who you’re talking to — so you can tailor your content strategy and posting times accordingly.
Open the Insights tab in Instagram, scroll down to “Your Audience,” and tap “See All.”
From here, you’ll be able to see an overview of your follower breakdown for up to 90 days including:
Follower Growth (Overall, Follows, and Unfollows)
Top Locations (Cities and Countries)
Age Range (All, Men, and Women)
Gender
Most Active Times (Hours and Days)
Monitoring your follower growth over time, and comparing it with your content strategy, is a great way to understand what’s working for your account.
For example, if you notice a large uptick in followers after sharing an Instagram Reel, this is a valuable insight you can use to inform your future strategy.
TIP: If you’re looking to track your follower growth over a longer amount of time, Later’s Instagram Analytics track up to 12 months worth of data!
Key Metric: Top LocationsYou can also use Instagram Insights to get a better understanding of your audience – so you can get a better idea of your unique best time to post.
You can discover where your audience is based, as well as when they are most active; both valuable indicators for optimizing your Instagram posting strategy.
Later analyzed over 35M feed posts (excluding Reels and IGTV) to find the best time to post (in local times) for several regions. This can be used as a great starting point when used in combination with your unique audience top location insights.
You can also use Later’s Best Time to Post feature to automatically calculate your top 7 posting times based on your previous activity — then, you can easily set up posts at these optimal times with our Instagram Scheduler.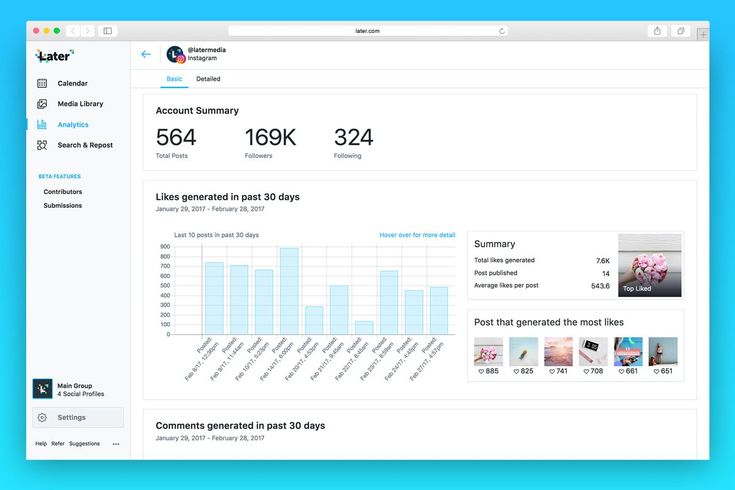
Upgrade to one of Later’s Starter, Growth or Advanced plans today and start capitalizing on your best times to post.
Part #2: Instagram Feed Post AnalyticsThere are 2 different ways to access feed post analytics in Instagram.
The first is through the Insights tab. Scroll down to “Content You Shared” and tap the arrow alongside your recent posts.
From here, you can sort up to 2 years of feed posts based on a whole range of metrics:
Call Button Taps
Comments
Email Button Taps
Follows
Get Directions Taps
Impressions
Likes
Post Interactions
Profile Visits
Reach
Saves
Text Button Taps
Video Views
Website Taps
NOTE: You may see even more options if you have Instagram’s Shopping features enabled (more on this later).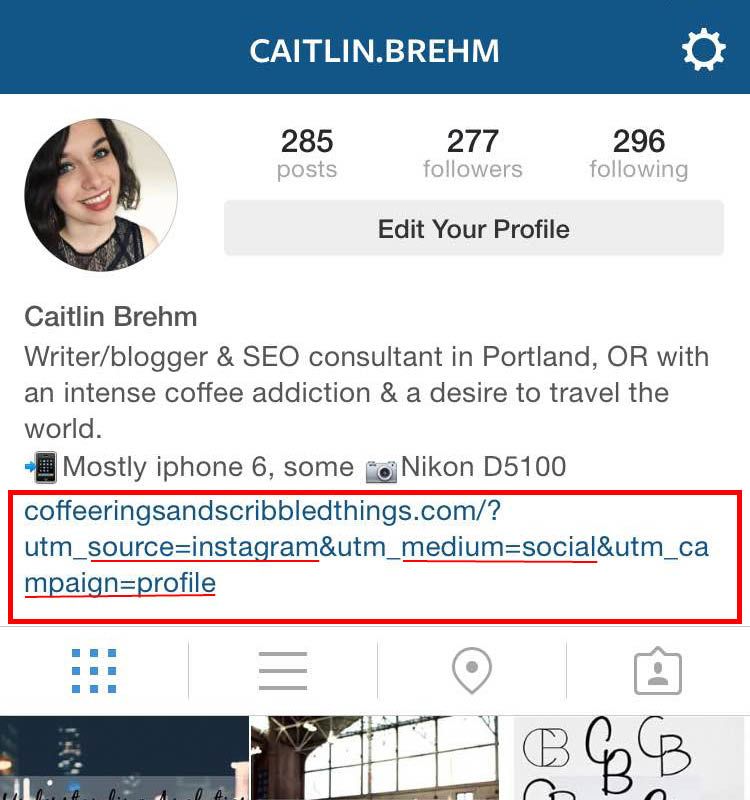
This is a great way to gain a holistic view of the content that has performed best over a set period of time — which can help inform your strategy.
For a more detailed performance overview, tap “View Insights” beneath a published post. From here, you’ll be able to see all the main metrics, including:
Likes
Comments
Sends (Only available outside of Europe)
Saves
Interactions (Profile visits and Website clicks)
Discovery (Accounts reached and Follows)
Impressions (from hashtags, home, profile, and other)
Each metric provides valuable insight for your account. For example:
Likes, comments, and sends metrics are a great way to learn what posts encourage engagement from your community.
Saves often show what content resonates deeply with your audience, provides inspiration, or has lasting value.
Website clicks are a strong indicator that your followers were inspired to learn more about your product or service.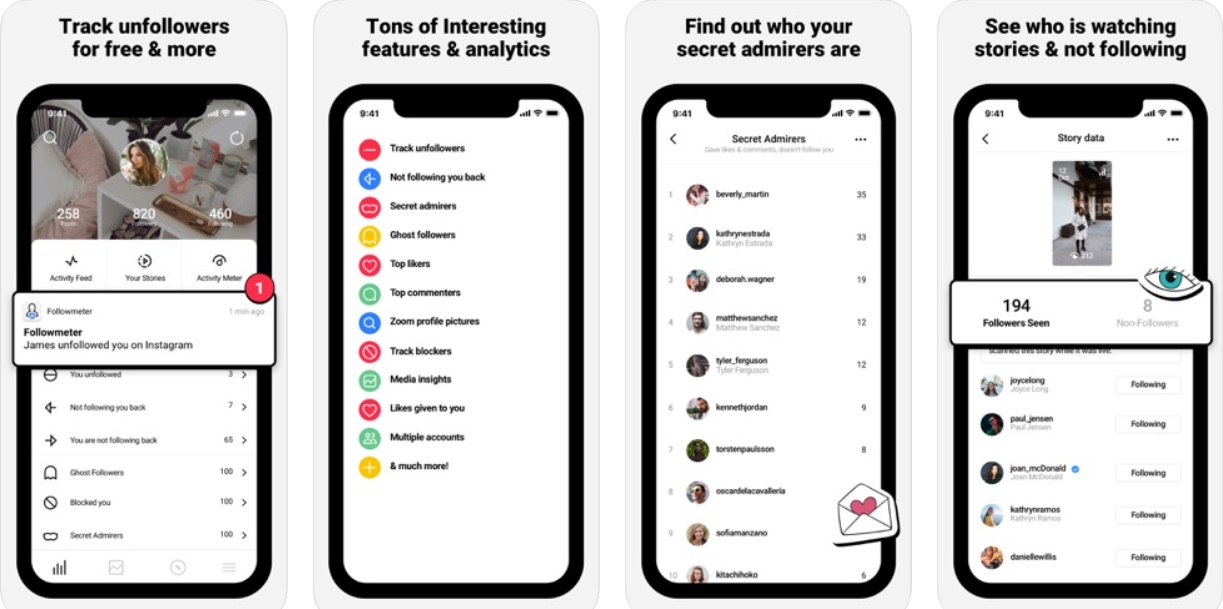
Impressions show how well your post is performing with the Instagram algorithm. For high performing posts, take note of where your impressions came from, the time and day of posting, and whether there’s any thematic content trends worth noting.
If you notice a lot of impressions in the “from hashtags” metric, this means you’re onto a winning formula with your hashtag strategy.
TIP: Get extra hashtag analytics with Later’s Detailed Hashtag Performance feature. Unlike Instagram’s native analytics, you can see the median number of likes, comments, impressions, saves, and reach per each individual hashtag you’ve used over the last 3 months.
NOTE: Later’s Detailed Hashtag Performance feature is available on Later’s Growth and Advanced plans.
Part #3: Instagram Stories AnalyticsMuch like with Instagram feed posts, you can discover Instagram Stories analytics through the Insights tab, or by swiping up on a live Instagram story.
On the Insights tab, scroll down to “Content You Shared” and tap the arrow alongside your recent stories.
From here, you can sort up to 90 days of stories based on the following metrics:
Back
Call Button Taps
Email Button Taps
Exited
Follows
Next Story
Get Directions Taps
Impressions
Link Clicks
Forward
Profile Visits
Reach
Text Buttons Taps
Website Taps
Reviewing your stories’ performance is a great way to understand what type of Instagram Stories work best for your brand.
For example, you may notice that posts with the highest impressions or reach all contain Instagram Stories stickers — a sign that this strategy resonates with your audience.
For a more detailed performance overview, swipe up on a live story and select the insights icon on the left-hand side of the screen.
Here, you can see:
Interactions (Profile visits)
Impressions
Follows
Navigation (Back, Forwards, Next story, and Exited)
Pay close attention to the Exited metric, as it can be indicative of where your audience lost interest in your content — and something to avoid in future.
TIP: Later’s Instagram Stories Analytics allow you can track and sort up to 12 months of detailed performance data in an easy-to-use dashboard.
Plus, Later automatically calculates your Instagram Stories’ completion rate, which is the percentage of viewers that watched all of your stories without exiting — a metric that isn’t available in the Instagram app.
Analyze your Instagram Stories data with Later’s Instagram Stories Analytics today — available on Later’s Growth and Advanced plans!
Part #4: Instagram Reels AnalyticsInstagram Reels analytics are a fairly new addition to the Insights tab.![]()
To access them, you can open the Instagram Insights menu, or open a specific Reel and tapping the three dot icon.
Metrics include Plays, Reel interactions, Reach, Likes, Comments, and Saves.
NOTE: Views of Reels shared to Instagram Stories are included in the overall view count.
Part #5: Video AnalyticsJust like with Instagram feed posts, you can view the performance of up to 2 years’ worth of video through Instagram’s Insights tab.
To access this data, scroll down to “Content You Shared” and tap the arrow alongside the Video tab.
From here, you’ll be able to filter and rank your videos based on several performance metrics:
By assessing which videos kept your viewers hooked and engaged, you’ll get a good idea of what content you should continue to create. The more engaged your audience is, the more likely you are to carry favor with the Instagram algorithm.
To delve into the insights for an individual video, tap the three dots at the bottom of a published video and select “View Insights. ”
”
If you’re tagging products in your posts with Instagram Shopping, it’s a good idea to keep a close eye on which ones are driving the most value for your business.
For an overview of how your shoppable posts are performing, head to the Insights tab, scroll down to “Content You Shared,” and tap the arrow alongside your recent posts or stories.
From here, you should be able to sort your posts and stories by a few product-specific metrics, which will vary depending on whether your account has Instagram Checkout enabled or not.
To see how an individual post is performing, tap “View Insights” to see extra shopping-specific metrics in addition to all the others.
These two data points can be really insightful:
How? If a product post has a high number of page views but very few clicks, it’s likely that your product description, imagery, or price point isn’t compelling enough to convert into click-throughs or sales.
Instagram Live analytics are available through Instagram’s Insights tab.
Users can see the number of Accounts Reached, Peak Concurrent Viewers, Comments, and Shares.
Looking to level-up your Instagram Live strategy? Check out our Ultimate Guide to Instagram Live here.
Part #8: Instagram Guides AnalyticsWhen it comes to Instagram Guides, there are almost no Instagram analytics available right now.
As Instagram Guides are a curation of existing posts, products, and locations — views are counted in the metrics for the original content, but not available for Guides specifically.
This is something that will probably change as Instagram Guides continue to evolve, especially given their potential for driving e-commerce on the platform.
Ready to get started with Instagram Guides? Find out everything you need to know here.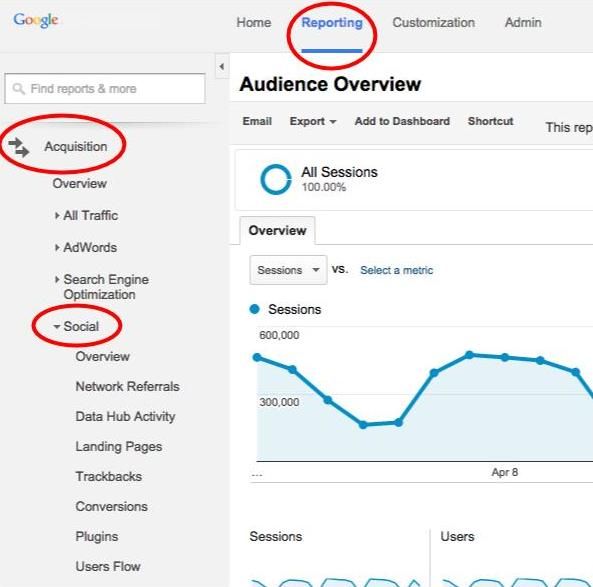
As you can see, there are hundreds of Instagram metrics you can track and report on — but trying to tackle them all might not be the best use of your time.
Having a clear view of your brand goals, and the key Instagram metrics that will help achieve them, is often a more efficient approach.
Once you’ve clarified your goals, it’s worthwhile creating a social media report to track your progress in a visually powerful and digestible way.
We’ve created free social media reporting templates available in PDF or Google Slides (Powerpoint).
Just fill out the form below to create your own analytics report and start showcasing your results:
Tracking your Instagram analytics over time will give you a better idea of what type of content helps achieve your goals, so you can build on your success in the future.
You can also download all your key Instagram metrics in a CSV file straight from Later’s Instagram Analytics dashboard!
However you approach Instagram analytics, understanding how your content performs can be a game-changer for your content strategy.
Test out different objectives, play around with your tactics, tweak your content, and see what sticks. The results may surprise you — in a good way.
And if you’re not sure where to start, Later’s Instagram Analytics dashboard has all the basics covered — sign up to Later today to get started!
Intuition alone will not get you far: for the effective development of an Instagram account, no one can do without analytics. To build a promotion strategy, adjust the current advertising campaign, work on mistakes and figure out plans for the future - for all this you will have to turn to statistics.
The main metrics for analysis are related to how users react to the account: for example, audience data (gender, age, growth, etc.), actions taken with content (likes, comments, saves, reposts), reach individual publications and the profile as a whole, etc.
Analytics will be useful for those users who maintain commercial accounts, or those who want to become bloggers.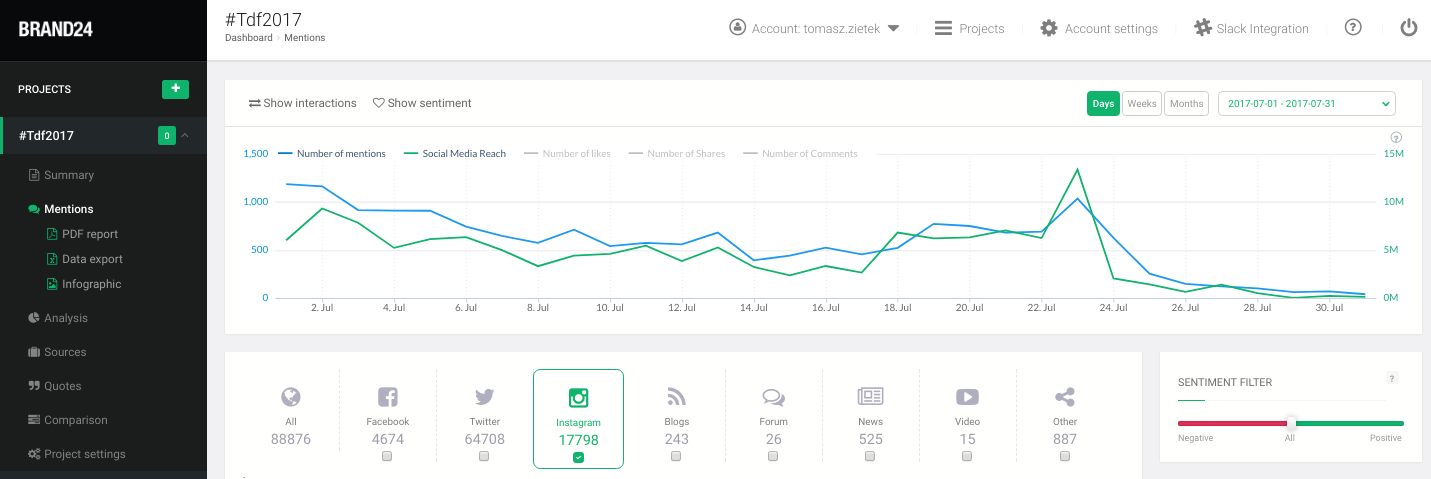 For example, if you want to promote yourself as a specialist: you sell goods or services, analytics will also be relevant for you.
You can analyze your account both in Instagram itself and in third-party services. I'll tell you about everything in order.
Instagram account analysis
At first, you will be quite satisfied with the analytics tools from Instagram and Facebook itself (besides, it's free). You can do it manually. To make social network statistics available, connect a business account or an author's Instagram account.
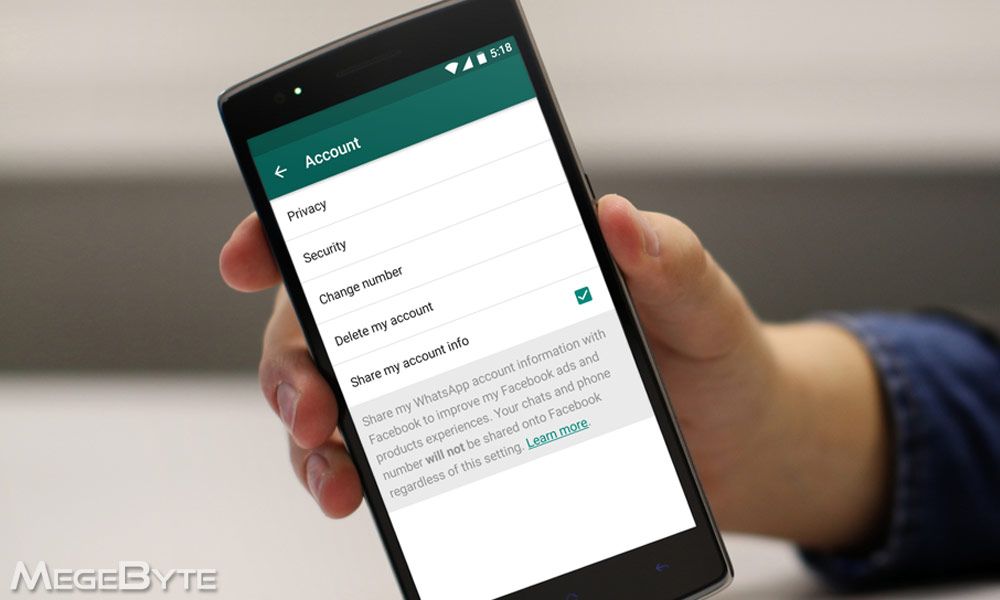
After that, in your profile, next to the publications and in the story, the "Statistics" button will appear - you can also open it by clicking the three bars in the upper right corner.
Instagram page statistics Another equally effective way to analyze the IG is the Facebook advertising account. There are many more technical features and metrics for analysis in the account, so it is better to create ads through Facebook. Even if you just want to raise publications, it is most effective to do this through FB.
The principle of operation is as follows: go to your FB account and in the "Advertising" tab, tap on the pop-up link to Ads Manager. Further, everything is very simple - click on the button with three stripes in the upper left corner and look for "Statistics". But, the main condition is that your account must be not just a personal page, but a business account.
Profile analysis through the Facebook advertising accountWe have already discussed everything about the statistics in the profile in the article below, so we will not go into details here.
Let's assume that we have dealt with manual analytics, so let's move on to third-party tools. In order not to bother you with the search, I offer a selection of personally verified by me.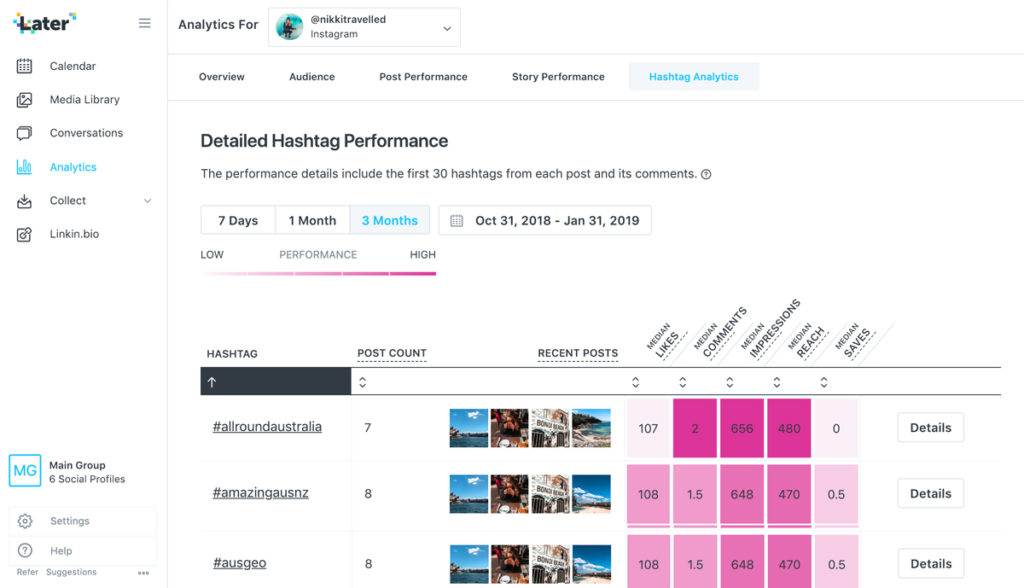
In fact, there are a lot of services for auditing an Instagram account - paid and free. Why are they needed at all? For convenience, of course. Firstly, it is more convenient to track statistics through the service and there are more indicators there - and secondly, the services offer a number of additional useful features. For example, you will be able to monitor not only your statistics, but also check the accounts of your competitors.
Important. To check through the service, the account must have the "business" category and more than 100 followers.
| Service | Cost | Free period | Download reports | Teamwork | Checking bloggers for cheating |
| Instahero | from 99 ₽/month ("INSCALE" -30% for analysis) | Yes | Yes | No | No |
| Livedune | from 400 ₽/month | 7 days | Yes | Yes | Yes |
| SpamGuard | from 99 ₽/check ("inscale" - 20% for analysis) | 1 check | Yes | No | No |
| Trendhero | 597 ₽/month | No | No | No | Yes |
| Instaspy | From 1490 ₽/month | No | Yes | Yes | Yes |
Let's analyze the most important indicators using the Livedune service as an example.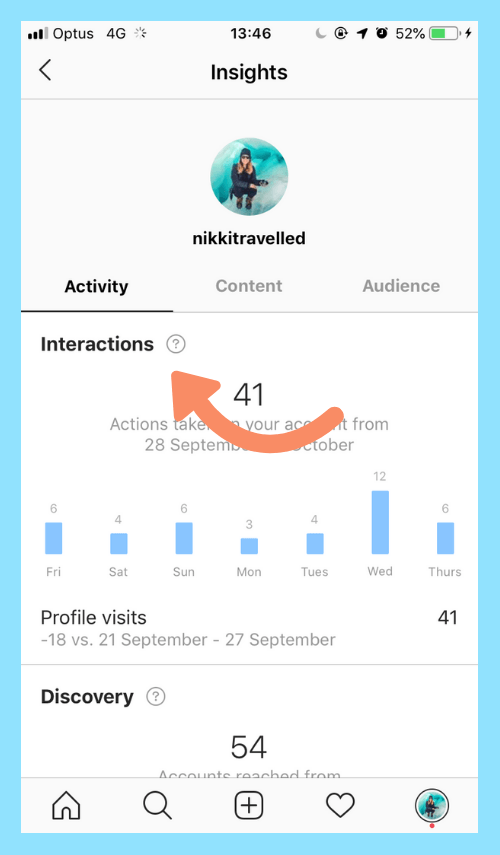 Just remember that it allows you to link IG only through a Facebook business account (not to be confused with a personal page).
For fast bunnies. If you don’t want to read and you can’t wait to test the service yourself, then click on the link -> Livedune and get a gift: 30% discount + 7 days of access using the promo code “INSCALE”.
Evaluate the change in all parameters over time. If at a certain stage a lot of new guests come to you, adapt. Go back to information about yourself and your business. See what kind of people they are (gender, age) and adapt to them.
If you notice mass unsubscribes, analyze the reasons, change your strategy to keep your profile audience. Post content taking into account the time when the audience is online - this way more users will see it.
One of the key (and oldest) Instagram analytics metrics. Shows how popular the account is, and indirectly speaks about the reputation of your page. Well, if you notice that there are a lot of followers, and profile activity is low, you should think about deleting bots and inactive subscribers.
This parameter will allow you to keep abreast: you will be able to respond to changes in a timely manner, adjust your promotion strategy.
Evaluate after which publications or events within the profile (givas, games, broadcasts) people unsubscribe from you. Analyze your ad: maybe you have too much of it in your profile and it starts to bother followers. And in general - maybe not people unsubscribed from you, but bots and store accounts.
Speaking of bots. If you use cheating, then soon after there is a mass unsubscribe. This will hit your reach hard: content will be shown to fewer users.
 Your content plan for Instagram directly depends on this information. Let me explain simply: for example, your main target audience is bikers 45+, but at a certain stage you see that many women have subscribed to you. Knowing this, you will replace the post "Why the beard does not grow" with "Leather Pants Review".
 The metric shows the quality of your content and the response of the audience. Rate publications by likes, comments and saves. Look at what type of content the audience is more active in responding to. If your strong point is text, then choose the optimal length of posts.
As advertising
In the "Posts" tab, publications are divided into categories (letters A +, C, etc.) - the higher it is, the greater the reaction caused the content. In the table - the number of likes, comments, saves, impressions, and you can also see the engagement.
Interesting. Get more hits and sales on Instagram with the help of the top Taplink multilink service. With it, you can create any form of communication (viber, WhatsApp, Telegram), create cool websites and online stores, and accept orders and payments directly on Instagram. Click and test for 7 days for free -> Taplink (Promo code "inscale20")
The service will show you the most effective hashtags. The correct use of hashtags on Instagram will attract people who are interested in this topic to your page - that is, in fact, future customers. And they will also increase coverage and help you get into the recommended. Of course, the hashtags must match the content of the post.
I remind you that in one post you should not use more than 20-30 hashtags, and even more so choose all high-frequency ones (from 100 thousand publications). The statistics won't thank you for that.
In Instagram analytics, it is much more important to see not impressions, but reach: this metric shows the number of unique users who saw your post. The higher the reach, the more chances you have to get new followers.
Control the dynamics of coverage for the day, week, month. The main thing is that the graph grows smoothly. If suddenly the curve crept down - evaluate the time of posting (discussed above), hashtags, participation in giveaways. By the way, you can learn more about coverage by reading the article below.
Interesting. You can quickly and safely promote your social network by boosting likes, reposts and views on publications. This is an inexpensive and safe way that will not make you wait long for the result. And most importantly, you will be able to increase coverage and get a hot target audience. Click and use -> TapLike
The metric shows what percentage of your subscribers interacted with the content (likes, comments, reposts, bookmarking). There are two evaluation parameters for this metric:
 All subscribers are counted here, regardless of whether they saw the publication or not. Formula: Engagement Rate = reactions/(posts * followers * 100) ;
 Try to stir up your audience: broadcast live, arrange polls, games, tests in stories, ask questions in posts, ask for opinions, etc. You can read more about engagement on Instagram in article
Engagement graphLook at your story statistics, find out which stories users watch to the end and which ones they scroll through.
By the way, read below about which stories will best engage the audience (and it's just useful for inspiration).
Interesting. Livedune is equipped with another useful block - checking bloggers for cheating. The service on the charts will display sharp peaks of subscriptions and unsubscribes, bursts of activity in publications atypical for live subscribers - and will estimate the share of purchased likes.
Let's look at this issue with a specific example. If you are standing, then it is better to sit down, because we will analyze the accounts not of Vasya and Petya, but of Alisher Morgenstern and Instasamka. Why? - you ask. The fact is that lately these rap artists have been creating a lot of newsworthy stories to talk about them, which naturally affects the statistics of their social networks.
Involvement .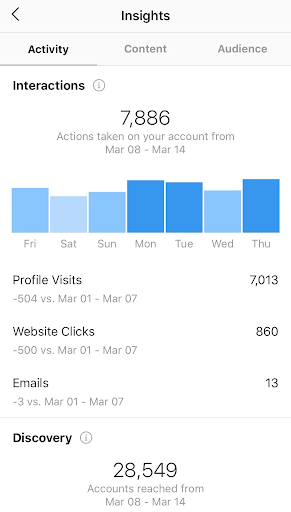 As mentioned above, engagement shows the level of interaction of subscribers with the content that the author publishes. In practice it will look like this:0003 Instafemale (left) and Morgenstern (right) audience engagement analysis
The following conclusions can be drawn from the image above: Instafemale account shows a significant decline in audience engagement with content since December 21st. It is possible that on days when the ER indicator dipped noticeably, the blogger either did not publish content at all, or most likely advertising integrations were published in the profile. In general, something that subscribers are not particularly interested in.
According to Morgenstern's engagement analysis, we can say that the level of activity of his subscribers is proportional to the number of posts that he posts.
Likes. Likes - this is the indicator that directly indicates whether you are publishing a "top" or "such a thing. " Here the situation, in principle, is also clear.
On the Instagram page, there is a jump in likes and their subsequent increase since the beginning of August. It was at that time that the rap artist began an advertising campaign for her upcoming album, which was released in mid-November. And as you can see, the campaign was very successful.
Alisher's situation is ambiguous. Until December, the number of likes was at a stable level. However, everything changed when in December the rapper was charged with selling illegal substances, as a result of which he was forced to leave Russia. After a short silence on Instagram, Morgen nevertheless got in touch with a new track, in which he spoke about the reasons for leaving the country, which caused an explosion of reactions and activity in the account, respectively.
Let's recap. If you, for example, are a beginner blogger, then it will be enough for you to conduct account analytics manually using the IG itself or your Facebook account. Another thing is if you use your IG profile to conduct business. Here you can not do without the help of special services. Let's say you have invested in an advertising campaign for your product and are waiting for a "return". As a rule, it is quite difficult to immediately determine the effectiveness of advertising, and this is where analytics programs come in handy.
Yes, the main functions of statistics services are monitoring and analysis of the current situation on the page, but there are also other functions that will be useful when choosing the right service:
 For business development, it is important to have an idea about competitors, their target audience, the time of publication of their content, and so on. Not all services provide such data, so this is also important to consider when choosing the right program.
 Not analyzing your page is irresponsible and inexcusable, especially if you run your own business in social networks. You can use basic and complex metrics to analyze statistics on Instagram. Everything here will depend on your ultimate goal. But, in any case, analytics services will serve you well in the development of your account.
If you have an Instagram account, you probably understand how important it is to track its performance. Determining the target audience, analyzing user engagement in content, evaluating the effectiveness of publications and promotional posts, analyzing the audience growth rate, knowing the most productive hours for posting - all these are the most important components of successful promotion on Instagram. Therefore, let's talk about how to conduct Instagram account analytics.
Let's start with the fact that Instagram statistics can be viewed both in the social network itself and in third-party applications and services. We will tell you how to view statistics in the Instagram app, and at the end of the article we will share a shortlist of services with advanced analytics capabilities.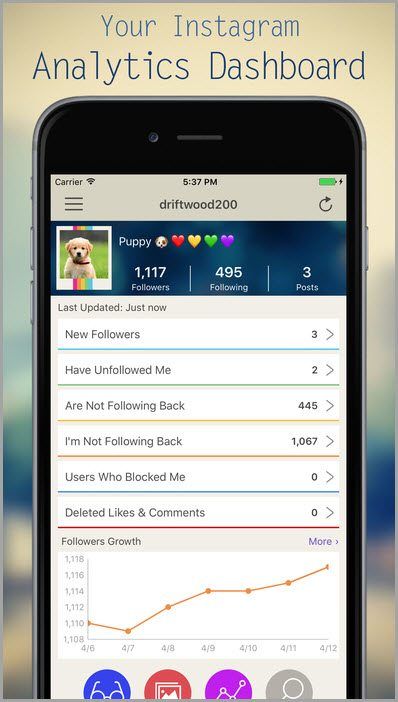 Let's go!
Instagram statistics can be viewed in the service itself, but only in a business account and only in a mobile application. With this data, you can more accurately define your target audience, as well as understand how effectively they interact with your content.
902
The simplest thing you can track in your profile even without connecting to a business account is the number of subscribers and posts, as well as the number of publications in which the account is tagged (in the "Marks" tab). You can also track the number of mentions of your unique hashtag by simply clicking on it.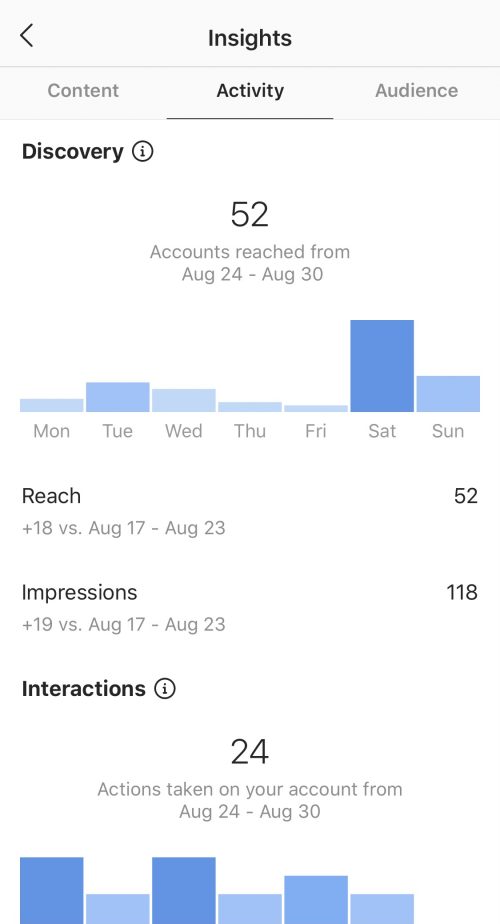
In a business account, both general profile statistics and data for each publication are available. To view data for a specific post, open it and click "Statistics". You'll see the profile's reach and visits, the number of likes, comments, shares, and saves, as well as a summary of impressions from different sources (from Home, from hashtags, from profile, from Other).
But in order to track the effectiveness of the channel management strategy, these data alone are not enough - you need to understand how these metrics change over time. To do this, use the "Statistics" of Instagram, which is available in the account section of the same name and is presented in the form of 3 blocks: "content", "actions" and "audience". Let's consider each of them.
The content section provides statistics about your posts in the feed or stories. But in order to draw the right conclusions from these statistics, you first need to understand what each of the indicators means. Sometimes beginners confuse, for example, “reach” with “impressions”, statistics in stories can also be misinterpreted. The tables below will help you sort things out.
Statistics of publications in the feed allows you to see the effectiveness of posts according to one of the specified criteria: “impressions”, “reach”, “engagement”, “saves”, “subscriptions”, “likes”, “profile visits”, "reposts", "SMS", "clicks to the site", "calls", "e-mail. letters." You can view data for a specific period of time: 7 days, 30 days, 3 months, 6 months, 1 year and 2 years. Use the filter to select display criteria.
Stories post statistics provides information on criteria such as impression, reach, scroll forward, scroll back, exits, replies, shares, next story, "link clicks". You can view statistics for 24 hours, 7 and 14 days.
This section provides general data about how followers interact with your account.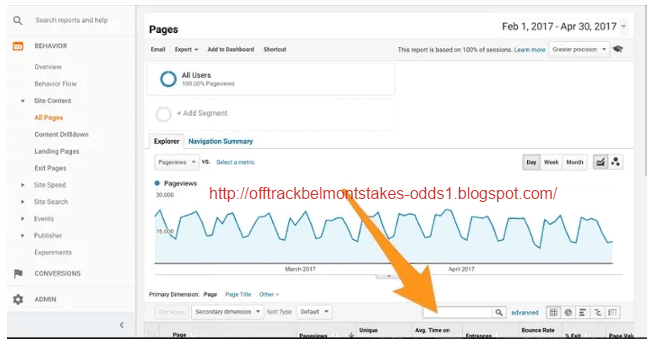 Here you can see information on reach, impressions, profile visits and interactions - for the last 7 days and in comparison with the previous period.
The Audience section shows the following/unfollowing and net user growth, as well as subscriber demographics: location (based on the top five cities and countries), gender, and age. These statistics will help you better understand your audience, reflect on whether it matches your ideas, and possibly make changes to your content plan.
Here you can also see what days and hours your followers are most active, and based on this, choose the best time for posting.
While native Instagram analytics provide important statistics about an account and give a general idea of content and ad performance, there are metrics that can't be tracked in it. Let's take a look at what these metrics are and where they can be studied.
In the Instagram application, you can find out the net increase in subscribers for a certain period, but, unfortunately, this metric cannot be tracked in dynamics - the social network does not give a complete picture of the growth rate of the audience. But you can easily find this data in the Picaton service, as in any of the following.
Instagram provides the most important information about the engagement of the audience in the content - for each of the posts and for the account as a whole. But, if you want to know more visual statistics, such as the level of engagement on a particular day or in dynamics, or the talk rate, which determines the position of a post in the feed, use other services.