January 27, 2014
UPDATE: Based on recent changes to the platform listed in this article, please visit this more recent blog post with a list of current tools to manage and track your Instagram analytics.
Let’s face it, if you’re using Instagram for business, you need to be tracking Instagram analytics. Just like any other social media site, you should have a strategy in place on Instagram. And in order to monitor your progress and execution of that strategy, you need to know how you’re performing. The best way to do this is to track your Instagram analytics regularly.
But, as I’m sure you’ve noticed, Instagram doesn’t provide any sort of analytics platform within the app itself. Thankfully, though, a number of third party apps are available to help you determine how you’re doing.
While there are a number of options available, I use and recommend Iconosquare. It’s a free platform to use and the only setup required is connecting your Instagram account. After you’ve connected your account, they do all the work for you. And your analytics are updated daily so that you can easily keep track of your information. You can even set up email notifications to receive an alert every time your Instagram analytics are updated.
When you first access your Statigram account, you’ll land on your Overview page. This page is exactly that, a quick overview of your account. You can see how many followers you have, how many people you are following, and the total number of likes and comments you’ve received. But you’re gonna want to dig deeper into your analytics than that.
Here are some of the best things I recommend to track on Statigram.
From the left menu, click on the “Community” tab to view your followers and followings information.
Here you can see, on a graph, how your community is growing. It’s also broken down into three categories: Followers You Don’t Follow Back, Reciprocal relationships, and Followings Who Don’t Follow You Back. Ideally, you want to have a lot of reciprocal relationships and you want to minimize the number who don’t follow you back. I’m not saying that you should unfollow people who don’t follow you back. We all have plenty of people (celebrities, businesses, favorite igers) who we follow and who don’t follow us back. But if your goal is to foster relationships and build a community on Instagram, you want to connect with people who have an interest in you as well.
At the top of the page where it lists the numbers of each category, you’ll notice there’s a little magnifying glass next to each number. If you click on this magnifying glass, Statigram will show you all of the people from that category. This is an easy way to go through and manage your connections, whether to follow someone new or to unfollow someone.
You can also see your week’s newest followers and your lost followers on this page.
At the bottom of the page you can see the people you follow who you are most active with and how many of your “likes” given were to those you follow or not.
To determine how your posts are performing or how you can improve them, click on the “Optimization” tab on the left menu.
Here you can see when your audience is most actively engaging with your posts, the average lifespan of your posts, and what hashtags you’re actively using compared with the most popular hashtags on Instagram.
To determine your best posting schedules, analyze the Best Times To Post graph. Your posts times and frequency are represented by black circles outside the graph. Your audience’s engagement is represented by grey circles inside the graph. The larger the circle, the more frequently that time is active. For example, as you can see from my graph, I post most frequently at 6:00 am, 4:00 pm, and 5:00 pm on Tuesday, Thursdays, Fridays, and Saturdays. And my audience is most engaged with my posts at 5:00 pm except on Tuesdays and Wednesdays.
Knowing when your audience is most active is important to your strategy in order to maximize your post results. It’s also worth noting that this information can change frequently. I’ve had peak posting times vary from 4:00 pm to 8:00 pm.
Click on the “Engagement” tab on the left menu to see your monthly levels of engagement.
The first set of data is related to the likes you receive. The top graph shows you how many total likes your posts receive every month and the average number of likes you receive per post. Depending on your posting frequency and the types of posts you share, you may notice up and down trends in your results. Statigram also shows you your most liked photos of all time.
The second set of data is related to the comments you receive. The graph shows you how many total comments your posts receive every month and the average number of comments you receive per post. You will also be able to see your most commented posts ever. If you want to boost your level of engagement with comments try different methods: including CTAs on the image itself, asking questions in your post caption, polling your audience for answers, and other methods.
If you’d like to see your most engaged followers every month, click on the “Rolling Month Analysis” tab from the left menu. Scroll down to find the list of your 10 most engaged followers.
If you’d like to see your post distribution, click on the “Content” tab from the left menu. Graphs show you your overall total posts and monthly post distribution. You can also see your post distribution by day and hour.
Statigram also provides additional functions within the platform which I recommend you look into. Overall they provide a robust and significant analysis of your Instagram account in order to ensure you see the best results with your Instagram strategy.
If you haven’t yet set up an account with Iconosquare, head over and set one up now. Keep on top of your Instagram analytics this year to really grow your Instagram presence and see real results.
Did you find this helpful? Please share:
instagram, instagram analytics, instagram for business, instagram marketing, social media, social media marketing
Instagram is now (finally?) giving us the option to pin posts to our profile grids. To be honest, I’m really freaking
Read More
Reels on Instagram (and on Facebook) are getting a lot of press lately. And for good reason. Meta has gone ALL
Read More
Instagram has long included “Suggested Posts” in the home feed, but we’ve all seen the frequency of these posts increase over
Read More
Instagram is actively rolling out the ability to “like” an Instagram Story. While, in the past, you’ve never been able to
Read More
It may be that you’re transferring your Instagram account or realigning your brand. Or maybe you’ve uploaded so much content to
Read More
Instagram Posting on Desktop is HEREYes, after alllll these years, and endless requests from pretty much every social media manager on
Read More
Measuring Instagram engagement rates for business-related decisions in influencer marketing, content creation, algorithm-optimization, and advertising is crucial, but how exactly should we measure it, and why is it so important? Let’s break it down.
Engagement is the most important metric on Instagram because it tells you how strongly an audience cares about the content (and that’s how you make money).
When building a business on Instagram, everything you do should be focused on 1. maximizing the number of people who look at your content and 2. care enough about it to take action whenever you ask them to do anything (tap, click, buy, comment, share, think, etc.).
You can buy or hack your way to millions of people looking at your content, but if none or a very low percentage of them care enough about it to engage with it (like, comment, share, save, repost, etc.), then how can you expect them to make the even more involved step of visiting your website, or buying your products, or donating to your charity, or being interested in the products you promote? You can’t (and you shouldn’t).
You, I, and most other people look at hundreds of posts on Instagram, but we usually only “like,” comment, share, save, or buy the ones that we care about. The posts that we don’t care about, we tend to ignore. We also tend to engage the most with the posts from the people we care about the most.
Being able to create content that generates real engagement is the first necessary step to driving traffic and creating monetary value on Instagram (traffic = people who are interested in buying your product = sales = monetary value).
That’s why highly engaged influencers on Instagram are getting larger paying contracts than content creators who only have a large follower number, but not high engagement. All things equal, out of two Instagram content creators with the same amount of followers, the one with the higher engagement will drive better results because a larger percentage of their audience takes action when viewing their content. That’s why you want to have the highest engagement possible on your account or pay to be tagged by influencers who do if you intend to make money on Instagram.
Here’s how you measure engagement properly:
To measure engagement properly, you want to know an account’s current engagement, not its historic one. That’s why you calculate the average number of likes on an account’s posts four through ten. These are the posts that generally give you the best indication of its current engagement during the past week or two. To calculate, you add the number of likes in posts four through ten and divide that number by seven.
 And one bought comment will make a much bigger difference in manipulating engagement rate than one bought like, since there’s a much smaller number of comments than likes on the platform. This makes likes generally much more complicated to manipulate consistently over time in comparison to comments. Also, average like engagement metrics on Instagram are readily available, which allows us to know what high or low like engagement is, in comparison to other accounts (more on this later). There is no such engagement data for comments, which makes it a less useful metric when comparing.
If the account that you’re measuring posts more than once per day, you should calculate it by measuring posts 4–15 and dividing that number by 12. By taking into account a larger number of posts, you’ll be measuring closer to one week’s worth of engagement (since they post more often).
Once you have the average number of likes in post four through ten, you divide that number by the total number of followers of the account, and you get the engagement rate.
The higher the engagement, the larger the percentage of their audience cares enough about the content to take action. The higher the likelihood that they are willing to click, follow, or buy something tagged in their posts, the higher the value.
Here’s a guide to understanding what is good and bad engagement on Instagram:
I wouldn’t expect any significant value driven from Instagram accounts with 12% or less engagement.Knowing this, if you are paying an influencer to promote your brand/product/account, I recommend that you work with someone who has at least 12% engagement. They are much harder to find (here’s an article on how to find the most valuable influencers), but they are in the top 1% of most highly engaged accounts on Instagram and the most likely to give you the highest return per dollar spent. In the same line, if you are a content creator, you should aim to have at least 12% engagement (and over 15K followers) to be able to charge top dollar now and in the future. With the amount of content competition on Instagram, accounts in this tier are the most likely to be able to build long-term highly valuable businesses.
Last but not least, if you’re calculating engagement rates to make decisions regarding influencer marketing or potential partnerships, it’s important to make sure that the numbers you’re measuring aren’t artificially manipulated.
To do that, first, check their comments to see if they seem to have a high percentage of pod-related or Instagram bot-like accounts leaving inauthentic comments (pods are commonly used by influencers to artificially raise engagement rates). You can also use Social Blade to check for inexplicable and frequent spikes in follower growth (most people who buy followers will buy engagement) or just be plain sure by using third-party tools like Hypeauditor to get a professional audit (they charge, but they are the only reliable Instagram audit service I’ve found so far). If you want to learn more, here’s a guide on how to automate an Instagram bot.
Overall, if it seems fishy, it probably is, so stay away from accounts that you’re wary about. There are more than enough highly-engaged, accessible, awesome-looking content creators with 15%+ engagement out there to work with (i.e., @zolita, @sheckwes, @pr0matic, @aubrey.anna, @ripcris, @alekrduncan, @_emmachamberlain, or thousands of others … )
That’s it! You now know how to properly measure engagement rates on Instagram.
So, if you want to earn money from your account, work hard to create content that people love to engage with, or pay people who do to promote you. It’s the only way to build a long-term sustainable business without spending tons of money on ads!
Oh yeah, and if you want to learn more about other strategies that’ll help you grow on Instagram quickly, read these articles on what Instagram really is and how works, how the Instagram algorithm works, Instagram niches and why they are the key to growth, everything you need to know about Instagram hashtags, how to write an Instagram bio, how to increase your Instagram engagement, how to pick the right Instagram username, Instagram bots 2021, how I make money on Instagram, how to create a visually appealing Instagram grid, why you’re losing followers and how to fix it, how to create effective Instagram story ads, how to build an Instagram repost account that makes money, how to check if you’re shadowbanned, how to create effective Instagram sponsored posts, how to automate your Instagram posts, as well as everything you need to know about TikTok Bots, how to find the most valuable influencers on Instagram, how to measure what an influencer is worth, how to reach out to influencers, and how to measure your influencer marketing ROI, everything you need to know about TikTok Bots, how to know if your Instagram is worth growing?, the best Instagram content scheduling and post automation tools,
Good luck pals!
Btw, here’s an article about the best Instagram content scheduling and post automation tools. Using them will help your posting process a lot more efficient 👍🏽
Instagram account analytics service - LiveDune provides in-depth statistics of your profiles
Try for free02
Graphs help to understand how quickly followers are gained in the account: how many people were there a week ago, a month. And the “Subscribed / unsubscribed” graph helps to understand how much the audience has updated over a certain period. Usually, if there was a lot of influx of a new audience, it makes sense to adapt the content for beginners.
Try for free03
In the LiveDune Instagram account analysis service, you can build top or anti-top posts using filters, sorting and combinations of indicators. Analyze content by ratings, categories, post type, likes, comments, saves, views, reach, engagement metrics (RR, ER, ERR), etc. This will help you understand what content to post and answer the question “How to increase statistics on Instagram?”.
04
Check Instagram engagement using LiveDune can be assessed using two metrics: ER and ERR. The higher the engagement rate, the more active audience you have. We will not only calculate the engagement for you, but compare it with other accounts by the number of followers and in the same category.
Try for free05
Detailed statistics of Instagram account subscribers with the ability to track changes over the analyzed period. For example, to see from which cities you have been subscribed more over the past month. Data can be viewed visually in graphs or uploaded to Excel.
06
It makes no sense to focus on generally accepted peaks (9:00, 12:30, 17:00, 21:00) when publishing posts, as it was with the chronological feed. But focusing on the time at which the largest number of account subscribers is active is the most correct. In the table, we will show when your followers are online and recommend hours for posting.
Try for free07
You can see the TOP hashtags, using which the posts got the most reactions (likes, comments, saves). Or find out which hashtags your competitors use the most so you don't have to manually collect data. Hashtags are collected both from the text of the post and from the comments under the post.
Try for free08
On average, compiling an SMM report takes 8 hours. In the LiveDune Instagram statistics tracking service, you can set up a weekly and monthly report in several formats (PDF, email, Excel, Google Slides) in 5 minutes. Spend the saved time searching for hypotheses and insights to work out in the next period.
Download example PDF report
Download sample Excel report
Capabilities
Analyze the effectiveness of your content strategy and monitor your competitors.
Hourly collection of statistics on your accounts or competitors' accounts for detailed analysis and search for growth points.
More
New
Operators, tags, notes, dialog statuses, statistics and other functions will help you optimize your work with Direct.
More
Monitoring and processing of new comments, messages and mentions from social networks in one window, analysis of sentiment and response speed of managers.
Details
New
Regular express audit of your Instagram account with clear conclusions and tips for promoting your account.
More
Export reports to PDF, Google Slides and Excel . We will also send weekly and monthly reports to your email.
More
Set KPIs for each account and track their progress in real time. You no longer need to calculate anything in Excel.
Details
Schedule posts to all your accounts a month in advance in 5 minutes in one place. And we will publish the content, collect new comments and statistics on them.
More
It will help to select bloggers without markups and with good activity so as not to drain the budget.
More
FAQ
Post statistics, like other statistics, is available only on professional accounts: Business account or Author account. Read more about how to switch to a professional account in the article.
Reach is the number of people who have seen certain information in your account. It can be a post, stories, the blog itself or an advertisement. It only takes into account unique visitors, so repeated actions by the same person will not be counted. For example, if one person saw your post three times, that would count as 1 reach and 3 impressions. Impressions are always greater than reach.
After registration, add someone else's account to the Dashboard and view the statistics. On other people's accounts, statistics of posts, engagement and growth of subscribers will be available. Instagram profile analysis is available only for a Business account or an Author account.
To view Instagram account statistics online, register in LiveDune and add the account to the Dashboard.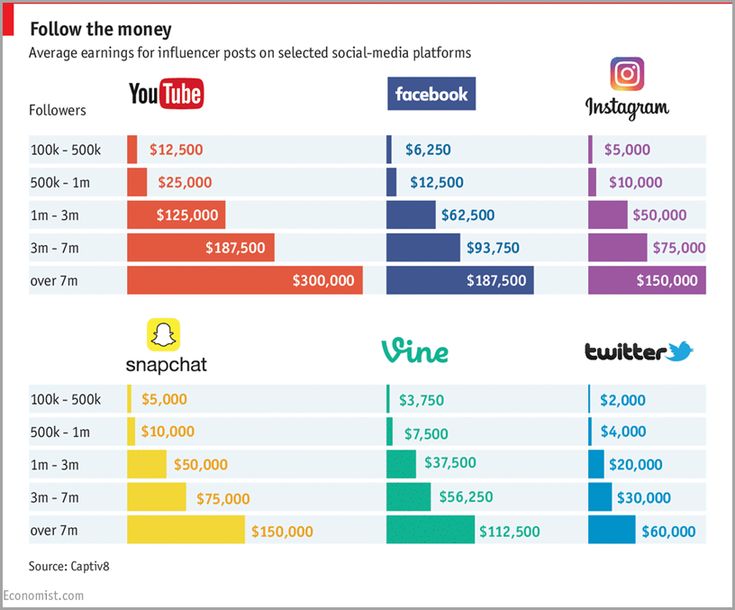 The first 7 days are free. Statistics are available only on professional accounts: Business account or Author account.
Engagement is the percentage of active audience from the total number of subscribers. You can get acquainted with all types of engagement indicators and the formulas by which they are calculated in the article.
Sign up and add an Instagram account to the Dashboard. Next, open the Stories tab.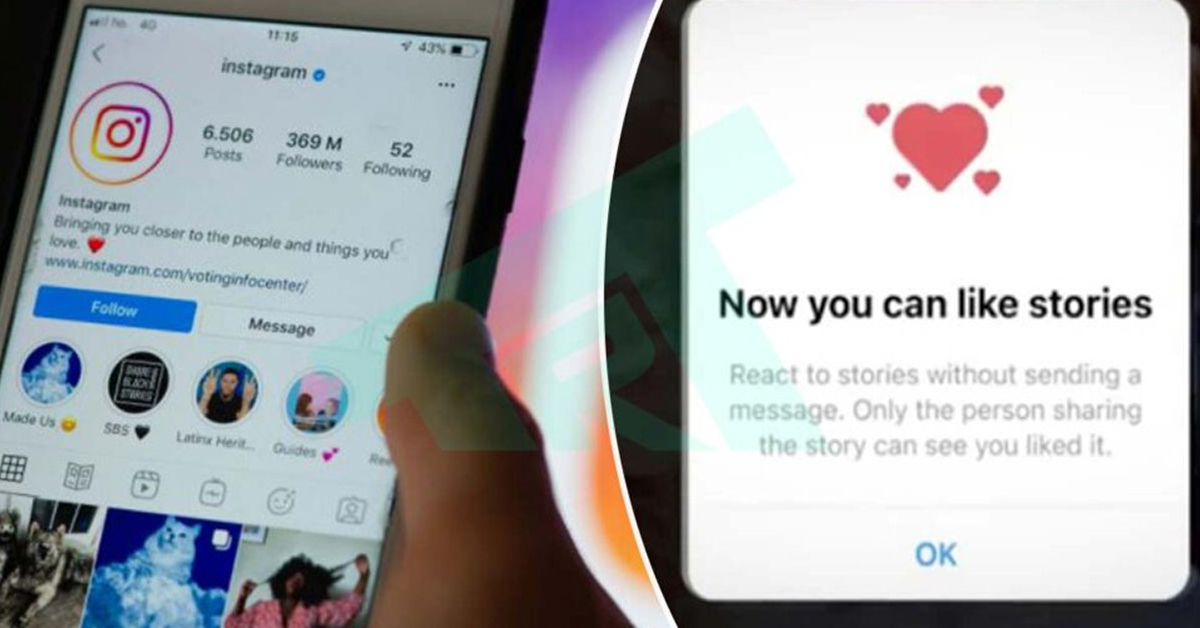
Only available for own accounts.
Sign up and add an Instagram account to the Dashboard. Next, open the Posts tab. At the end, you will find 3 graphs to analyze the performance of hashtags. Hashtag statistics analysis is only available for new posts.
Your accounts are safe because we work with social networks officially and do not ask for passwords.
There is a description for each graph and each figure - you can easily understand what this or that metric means.
Invite and set up access for colleagues to work on improving your accounts together.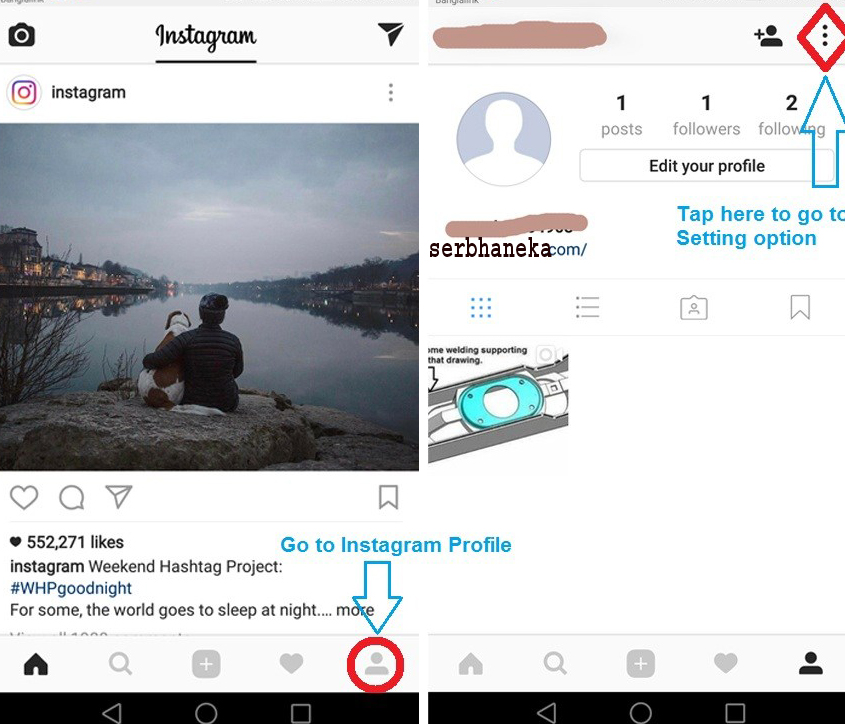
Do you have your own internal systems? Great, you can pull data from us, from one place.
Reviews
This is my main social media reporting and analytics tool. I sincerely cannot imagine my life without a dashboard and uploads from Instagram profiles. Based on the data from the downloads, audits are built, work is underway on strategies and project supervision. In my opinion, today Livedune is the most effective tool for analytics of your own pages in social networks and a must-have tool for anyone involved in SMM.
Alexey Tkachuk
SMM strategist and blog creator Dnative.ru
We use LiveDune to track our account statistics on a regular basis and to prepare reports. And based on the data received, we adjust the overall promotion strategy. We use the Dashboard as actively as possible (it’s convenient that there are post ratings and a section with data on advertising on Instagram has appeared) and the Comparison module. In general, we love LiveDune very much and are happy to test new features :)
Andrey Komissarov
Head of Communications Authentica and Shamelessly Talented
We have been working with LiveDune for two years now. All this time, the service is constantly evolving: managers respond to our requests and add new features that we need. We follow a couple of hundred accounts of our teams and divisions, players, so a qualitative comparison is required in various parameters. All of this is there and works great. It is also very convenient to keep track of all the KPIs of your VK and Instagram accounts: reach, engagement, views, popular posts. There are flexible reports with tables and presentations for management. The dashboard interface is the most convenient and understandable, it is a pleasure to work with it!
Artyom Sadovnikov
Head of the PR department of the Student Basketball Association
Livedune is love. Love, numbers and endless benefits. I have been working with the service since 2015 and connect absolutely to every project. First of all, I use it to analyze communities, pages and content. SMM is getting deeper every year, and you need to somehow understand all this. Reports, statistics, analytics - I go to Livedune for everything. Personal thanks to the developers for the Telegram bot for comments and project KPI management.
Stanislav Son
SMM HEAD FINNTRAIL Russia
.
Instagram account statistics could only be viewed using third-party services and programs, but now it can be done in your own account and even from a computer to Facebook in Creator Studio. Where is this statistics and how to do it on Android and iPhone?
Statistics on Instagram for the account as a whole, individual publications and Stories can be viewed for free, but first you need to create a business account or an author account.
👉 How to make a business account on Instagram
You will get statistics for the photo and the entire account after switching to a business profile or author account . You can do this for free. Previously, it was necessary to link the Facebook page. But now this can not be done.
But in order to run ads directly in the application, Facebook still has to be linked. To do this, you need to remember your e-mail and password from your Facebook account, as well as create a public page for your business account.
After transferring to a business account or an author account, you will see the inscription “View professional panel” at the top and the “Statistics” button.
If you immediately click the button, then you will immediately go to the Statistics of your Instagram profile.
If you click "View professional panel" - then you can see all the tools for working with a business account / author account. Including there will be a line "all statistics".
The third way to view Instagram statistics - in your account, click the three bars on the top right and select "Statistics"
Instagram account statistics can only be viewed from the current moment. Everything that happened before, no one will ever know =) Therefore, you will see some intelligible statistics for the entire account within a week, and only new posts will have photo and video statistics.
Statistics are needed not only to track the progress of an account, but also for potential advertisers who ask for the Reach and Engagement of an account before buying an ad. What does Instagram stats mean?
On the main screen, you can select a period from the top - statistics for the last 7 days or 30 days.
Accounts Reached - means how many people saw your posts, Stories and IGTV) in a week, plus a comparison with last week. It differs from Impressions in that here each person (account) is counted only once, even if he watched your posts several times. Therefore, Reach will always be less than Impressions.
👉 Instagram reach: what is it and how to increase it?
Click on Covered accounts and more detailed statistics will open.
Subscribers and everyone else (by reach) - how many of the covered audience were subscribed to you, and how many were not.
Content type - which content received the most coverage (also broken down by subscribers and unsubscribers)
Here you can also see which posts were the most popular in terms of reach. And if you press the triangle bracket 9 on the right0294 > , then you can filter statistics on Instagram by other indicators (comments, likes, subscriptions, etc. ).
).
Impressions is the total number of content views. One person could watch several times, different content. Therefore, impressions are always more reach.
Actions in the profile are visits to your Instagram account plus clicks on the buttons in the account header (email, store, phone, etc.).
YOUR AUDIENCE
Return to the first Instagram Insights screen. In the Your Audience section, click the triangle bracket on the right > . Statistics on subscriptions and unsubscribes on Instagram will open.
Increase - on this graph you will see the number of subscribers, unsubscribers and total (subscriptions minus unsubscribes).
Below are statistics by location, age and gender.
Peak periods - time (days and hours) when followers were most often on Instagram.
CONTENT YOU POSTED
Return to the first screen of Instagram Statistics. In the "Content you've posted" section, you'll see the number of posts/Stories/IGTV/Promotions in the last 7 or 30 days (depending on the filter on the top left). For each type of content, you can filter by all engagement indicators (impressions/reach/likes (likes)/comments/saves).
This will help you better understand the results of advertising from bloggers or giveaways. But this is only available for profiles with more than 10,000 subscribers. You can wind them up and go to the author’s account, especially if you don’t have enough 1000 subscribers and can’t wait to get new statistics right now. This will not hit the account engagement much. But ideally, of course, you need to grow organically, with the help of advertising from bloggers and targeting.
To find out the statistics of views (and not only) of each publication - photo or video on Instagram, you need to open the desired post and click "Statistics".
The top line of statistics is the number of likes, comments (👉 Comments on Instagram: how to talk subscribers), transfers to Direct and saves.
Saves - how many times the "save" button was pressed.
Visits to profile - how many times they went to the account from this photo.
Reach - how many people viewed the photo. On average, there should be 30-60% of subscribers. Less - a lot of bots that do not look at posts. More — if you ran an ad, got featured, the post turned out to be very popular, shared, etc. The larger your account, the smaller the reach in % of subscribers. Old followers abandon accounts or lose interest. This is fine. The highest coverage (in % of subscribers) is for accounts with up to 1000 subscribers. To increase your reach, be sure to post regularly, with a content plan. Even according to the coverage statistics on Instagram, you can understand whether you published a post at the right time or not.
If you swipe up on these statistics on Instagram, you can find out even more interesting things about the statistics of the post.
Profile visits - how many people went to your account after seeing this post
Reach - how many people saw your post.
Impressions - how many times your post was viewed. One person can view multiple times, so impressions are always more than reach.
From main page - how many people saw the post in the feed
From "Interesting" - views from the recommended tab, with a magnifying glass. The more, the more likely that the post has become "viral" (it is sent to friends, it appeared in the recommended). Also, a large percentage happens if you promoted a post.
From profile — how many people saw the post by logging into your account
From hashtags — how many came from hashtags
From “other” - all other sources
In a personal account, you can only see the total number and accounts of those who saw your Stories. To do this, swipe up from the bottom of any Story on Instagram.
After switching to a business or author account, you will have detailed statistics for each Stories on Instagram. What does each statistic mean?
INTERACTIONS
Total statistics on the number of reactions to your Stories:
Replies — how many people answered you in Direct on this Story
Clicks on the link — how many times after this Story they went to your account and clicked on the link in the description.
Visits to profile - how many times after this Story they went to your account.
REACH STATISTICS
Here you will see statistics on how many people see your Stories and how they find them:
Accounts covered by this Story (Reach) - total number of people who saw this Story
Impressions - how many times this Story was viewed .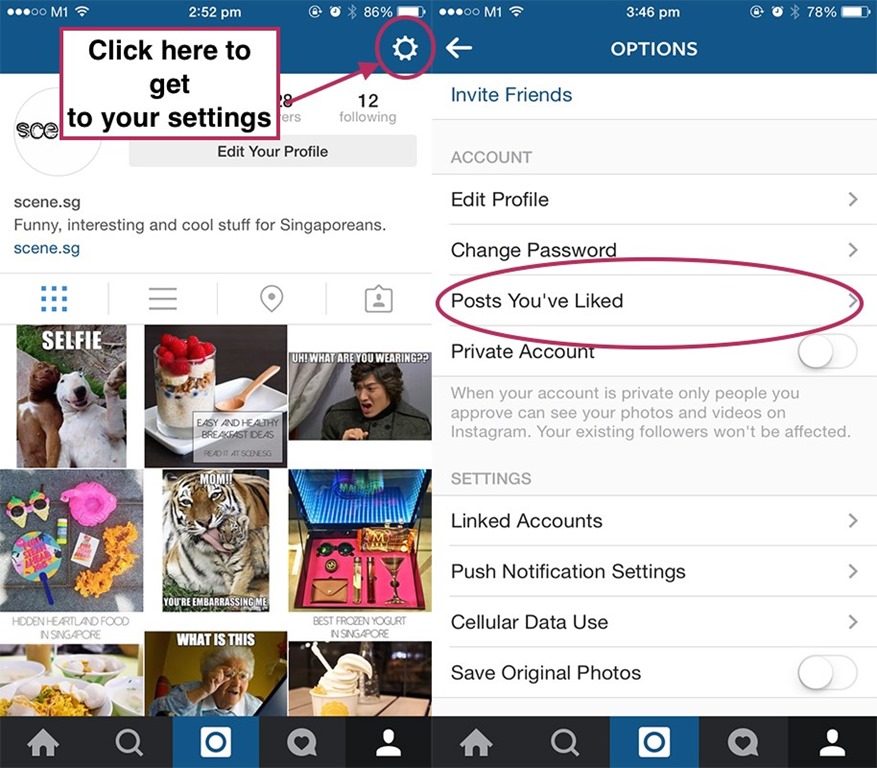
Subscriptions — how many subscriptions after this Story.
Navigation = back + scroll forward + jumps to next story + exits
back - number of taps back to your previous story0003
Forward - number of taps forward to view your next Story
Next Story - number of scrolls to next account's Stories. Here you can understand whether was interesting or not was History , whether a person wanted to watch your content further or moved to the next account.
Exits - the number of exits from the Stories view mode. Again, you can see the statistics of how the Story was able to keep the attention of subscribers.
Do not draw conclusions after the first week, how to connect free statistics on Instagram. Check how it will change for at least a month. Compare weekdays, weekends and holidays, good/bad weather outside.
Don't be in a hurry to "give it all away" if your coverage dropped in late spring and summer. Previously, no one had such statistics, and people who do not know the general trends in social networks and the Internet are afraid of fluctuations in statistics in their Instagram account. In the fall and after the New Year holidays, there is always an increase, and in the spring and summer there is an outflow. Of course, this does not apply to "seasonal" businesses (spring-summer travel agencies have growth, for example).
Even though many of us have a smartphone as an extension of our hand, we still scroll through Instagram less when we are on vacation, it’s summer outside, etc. Therefore, do not rush to arrange another giveaway or pour extra money on advertising if your coverage decline is seasonal. But do not abandon your account, if necessary, make pending posts for the holidays. Then even if you yourself are resting, you will still flicker in the feed of subscribers.
You will have the most reliable statistics a year after you make it.