Instagram Insights shows you engagement analytics that empower you to improve your Instagram for Business strategy.
You no longer have to guess about what works for your audience; Instagram Insights will tell you. You’ll therefore be able to get more likes, earn more followers, and grow your profile exponentially.
In this post, we’ll go over everything you need to know about Instagram Insights and how to leverage it to improve your Instagram profile.
Instagram Insights is a feature that allows Instagram Business Account users to see analytics related to their profile and posts. From this data, you'll be able to identify what your audience likes and engages with the most to improve your Instagram strategy.
Instagram Insights allows you to get access to important user engagement data for your business profile. It’s not just enough to know the raw numbers, such as the amount of likes you get for one post. It’s important to understand your audience, too.
That’s where Insights comes in. It tells you how they do things, what they prefer, and who they are. You can certainly make business decisions based on gut feeling, but you're much more likely to hit the mark when you can validate assumptions with cold, hard facts.
Data and analytics help you measure the impact of your marketing efforts across different channels to see if there's something you need to do differently — like target a different audience, post at a certain time of day, or experiment with a new content format.
Social media isn't any different from other aspects of your marketing in the sense that it can be measured and improved upon. That's why you'll be able to create a more effective Instagram strategy using Instagram Insights.
To use Instagram Insights, you must first have a business profile. The good news? If you're already using a personal account, you can switch to a business profile right from your phone. Here's how to convert your account in a few simple steps.
You can convert your Instagram profile to a Business account directly from your Instagram mobile app. First up, open up the app and click on your profile picture on the bottom right-hand corner of your feed.
Next, it’s time to head to Settings. On your profile, click the hamburger icon on the top-right corner.
On the pop-up, click “Settings.”
 Tap "Account."
A list menu will come up. Tap “Account.”
By switching to a Professional account, you can get access to Insights immediately — even if you’re not a business.
Choose the best category that describes you. Once you’re finished, click “Done.”
After, go back to your profile. Here’s what it will look like:
As you can see, you can immediately access Insights with a Professional account. If you’re a freelancer or content creator, you can stay as is, or you can take the extra step of switching to a Business account.
If you’re a business, organization, or brand, you’ll want to take the additional step of turning your Professional account into a Business account. A Professional account gives you full access to Insights, but is designed for independent digital creators. A Business account is more apt for companies.
Note that turning your account into a Professional account always comes before switching to a Business account.
To turn your account into a Business account, click the hamburger menu in the top right corner of your profile. Click “Settings,” then “Account.” At the bottom, click “Switch Account Type.”
Then click “Switch to Business Account.”
Done! You’re now a Business account with access to Insights.
Lastly, if you have a Facebook Business page, it’s important to connect it to your Instagram Business or Professional account. To do so, go to your profile and click the “Edit Profile” button.
Under “Profile Information,” click “Connect Facebook page.” Follow the prompts to connect your Page or create a new one.
Be sure to already have a Facebook account prior to connecting your page. Click here for instructions for setting up your Facebook Page if you don't already have one.
Once you’ve set up your Professional or Business Account, you can begin to use Instagram Insights.
Before we get into specific instructions for using it, however, here are the analytics on this channel that marketers need to know and understand — and how to use them.
Let’s look at Instagram Insights from a bird’s eye view and zoom in piece-by-piece.
Insights Overview is the “home page” of Instagram Insights. Here, you’ll see how you’ve fared overall.
You get several pieces of information on this page:
Now, let’s go into “Accounts Reached,” “Accounts Engaged,” and “Total Followers” in more detail.
In Accounts Reached, you’ll see more specific information about the users who have seen your content and interacted with your profile in some way or form.
Lets’ break down the different pieces of information you’ll find in this page.
 You can see the number of website taps, business address taps, call button taps, email button taps, and text button taps. For these metrics to show up, however, you have to have set up those buttons.
Accounts engaged refers to the number of users who interacted with your content beyond just watching it or scrolling past it. Let’s break down the sections on this page.
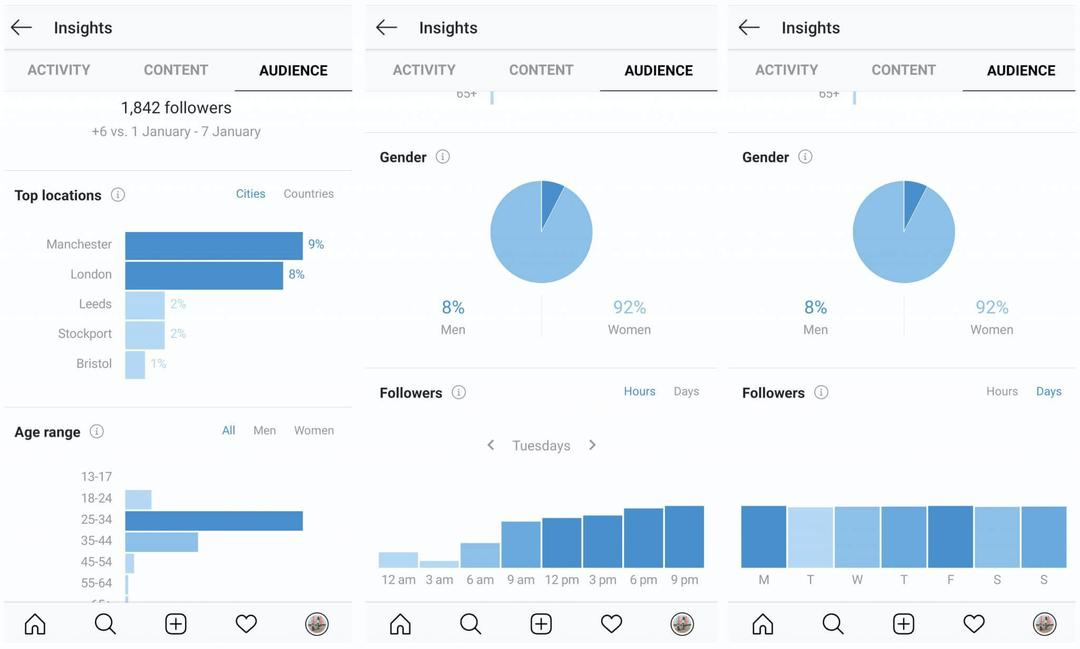
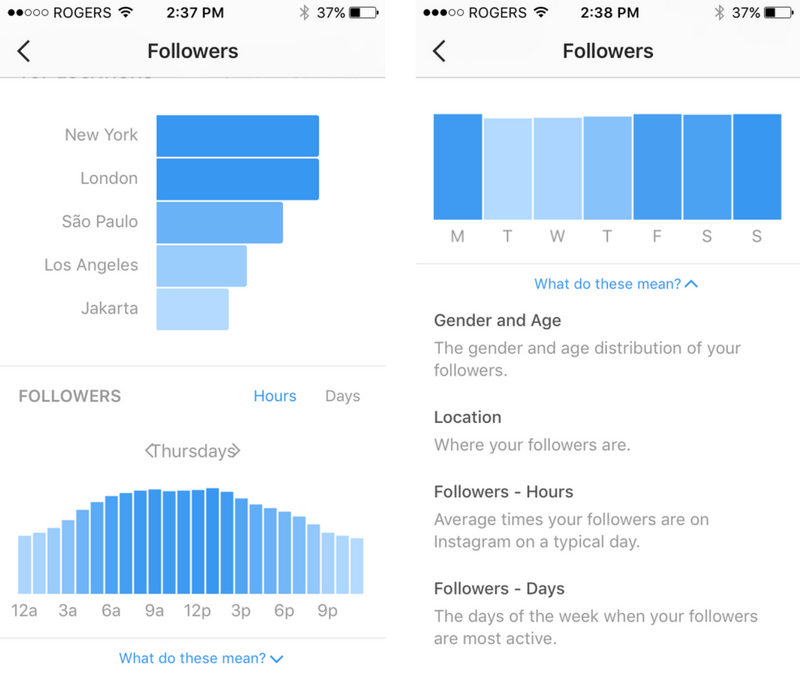
The total followers page of Instagram Insights allows you to see the total number of users who follow you. You can also see follows, unfollows, top locations, age ranges, and genders.
Under total followers and its demographic breakdown, you’ll then see one more section: most active times.
To see post insights on Instagram, navigate to your Instagram profile and click the button that says “Insights” right above your posts. Alternatively, click the hamburger menu on the top right-hand corner and tap Insights. There, you’ll be able to see Insights for all of your posts, reels, live videos, and more.
Next, let’s go over how you can see insights for individual posts on Instagram.
If your Story is currently live on your profile:
If your Story has already expired or more than 24 hours have passed:
If you’ve just finished your Live video:
If you broadcasted your Live video in the past:

Next, we'll get into how to use Instagram Insights in your day-to-day.
Instagram Insights is a fantastic tool, but it can be hard to know what to do once you gain access. Here are some of the most useful ways you can use Insights as you grow your Instagram profile.
Click the Accounts Reached section. As mentioned, reach reflects the number of unique users that have seen any of your Instagram posts.
Within this category, you'll see insights for:
Some of these insights can be expanded for more insights.
On the Accounts Reached page under Account Activity, you'll be able to see Profile Visits.
Profile Visits reflects the number of times your profile has been viewed.
Find out how many of your profile visitors are turning into followers by dividing your number followers by the number of visitors. Track this number over time to find out whether your “conversion rate” is increasing or decreasing.
Website Taps can also be found under Accounts Reached > Profile Activity. This insight reflects the number of times any links you've included in your business profile have been clicked.
Navigate back to Insights Overview and tap Accounts Engaged. This will bring up a page that shows how your content is performing in terms of engagement, breaking down the metrics by content type.
Likes speaks for itself, reflecting the number of users who liked your post. As with likes, Comments reflects the number of comments left on your post. Saves highlights the number of unique users or accounts who saved your post. If any of these numbers are low, it’s important to reevaluate your Instagram strategy.
Navigate back to Insights Overview and click Total Followers. You'll then reach the Follower Breakdown page.
This page reflects how many followers you've gained or lost over the past week, as well as the average times of day when your followers are using Instagram — data that can be highly beneficial when planning posts.
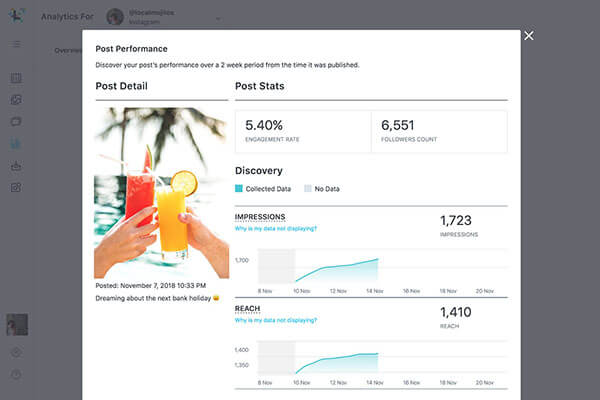
To view insights for a specific Instagram post, start by visiting your profile. Tap on the post you'd like to look into, then click View Insights below the image
Under the “Profile Activity” section, you’ll find out the number of actions that users took on your profile as a result of seeing your post — things like visiting your profile, then taking an action like clicking on your website link or following you.
Previously named “Discovery,” Reach indicates where your post was seen — or discovered — the most, including how many accounts weren't already following you when they first saw the post.
This section includes metrics on Impressions, which reflect the number of times your post was discovered from a particular place within Instagram, like the user's home feed, a search, your profile, a location tag, or a hashtag.
Reach insights also include data on a post's reach — which reflects the number of unique accounts that saw your post.
Instagram users with a business profile are able to view insights into their ephemeral Stories.
To view your Story insights, navigate back to Insights and scroll down to Content You Shared section on the Insights Overview page.
Scroll down to the Stories section, and you'll be able to see insights for older stories, as well as any that have not yet expired.
Next, we'll get into the more specific insights you can explore.
This insight represents how many times your Story was seen.
When viewing these insights, keep in mind that you're able to add multiple images or videos to your Story. When you do this, every piece of visual content in your Story is counted as a single photo or video in your post.
Let's say you add six photos to your Story. Whether someone only views one or views all six, Instagram only counts your entire Story having received one impression.
The same goes for Story content that has been viewed by a single user more than once. Instagram still only counts that interaction as the entire Story having received one impression.
This insight reflects the number of unique users that have seen your Story.
This insight reflects the number of times a user taps your Story photo or video to skip to the next piece of media.
This insight reflects the number of times a user taps your Story photo or video to go back to the previous piece of media.
This insight reflects the number of times users send messages through the Send Message text box on your Story.
This insight reflects the number of times users swipe to skip to the next account’s Story — not to be mistaken for "tap forward," which reflects users skipping ahead to your next piece of Story media.
This insight reflects the number of times a user leaves the Stories section entirely to return to the home feed.
Now that you know how to access data to inform your strategy with Instagram Insights, you can analyze that data and determine what's working for your audience (and what's not). From there, creating content that gets a ton of engagement will be a lot easier as you consider those benchmarks.
Editor's Note: This post was originally published in January 2018 but has been updated for comprehensiveness.
Topics: Instagram Marketing
Over the years, Instagram has transformed. It's no longer a platform where people just share selfies or post pet photos.
It has become a platform where you as a small business owner get unmatched opportunities to boost visibility & grow customer base.
But with increasing competition on the platform, it becomes vital to track insights to grow your business on Instagram.
Top brands & businesses are relying on advanced analytics as a core competitive advantage.
Analytics is helping them to agilely respond to real-time market changes & helping in winning customers.
At its core, Instagram post or story or reel insights are the science of mining data to measure marketing efforts & to see if any improvisation is required.
To measure the Instagram insights effectively, you require to understand the mechanism of the entire process.
Scroll through the blog to get an overall idea of how to track Instagram insights & ponder upon the tactics to grow your business profile.
"Information is the oil of the 21st century, and analytics is the combustion engine. " -Peter Sondergaard.
Insights on Instagram are the data that helps your business to analyze & understand your prospects. It is a great way to observe the basic analytics of your Instagram profile, your feed post, followers, reel & Instagram story.
Insights empower users by providing data about followers growth, visitors number & demography, engagement & reach.
Worthmentioning that Instagram insights are only available to business profiles & public accounts that receive a considerable number of engagement.
From the insights data, you'll be able to identify what your audience likes and engages with the most & accordingly improve your Instagram strategy.
However, the primary downside of the native 'Instagram Insights' tool is that you can track the metrics of your post or profile for a limited date range. Here social media management app like Statusbrew comes into the scenario as it allows you to measure the analytics for an extended date range.
Instagram analytics are essential to track as it empowers the user to understand the performance of your post and your overall account metrics.
Analytics offered by the native Instagram app helps to interpret the Instagram metrics & understand the pattern in them. For example, you can measure the number of followers you have with the 'Instagram Insights' tool, which is a metric.
It also equips you to get the followers' growth rate over a specific time, how swiftly your followers are growing; that is analytics.
There are two main ways you can access analytics of your account: through Instagram's native tool called 'Instagram Insights' or through a social media management tool like Statusbrew.
Suggested Read: How to Manage Multiple Instagram Accounts From Your Phone Or Desktop
Instagram insights are available only on the app, so you'll need to install the Instagram app to get the insights. However, to set up a business profile & to access your Instagram insights, consider taking the following steps:
Step 1: Open your Instagram app & change your Instagram profile to 'Public'.
Step 2: Now navigate to your Instagram 'Profile' & go to 'Settings'.
Step 3: Scroll down & tap on "Switch To Business Account".
Step 4: You'll see screen instructions to connect your 'Facebook Page.' For an Instagram business account, users require to have a Facebook page. Your Facebook page does not need any content, or it does not have to be branded; it simply should exist. If you do not have a Facebook page for your business during this fourth step, you can create one.
Step 5: Check all your details & once confirmed, tap on 'Done.
Once you switch your Instagram profile to 'Business Profile', you can easily access Instagram insights.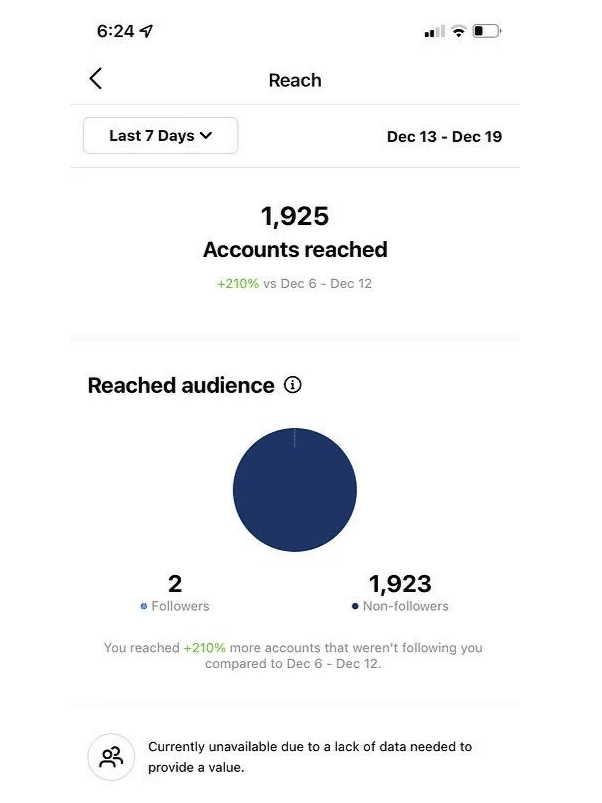 Check out steps to access insights on your business profile:
Step 1: Open the Instagram app & tap on your profile picture on the bottom-right corner to navigate to your profile.
Step 2: Tap on the three-bar menu on the upper-right corner.
Step 3: At the top of the menu, you'll find 'Insights' & to access it tap on the graph icon.
Step 4: You'll find three tabs, 'Activity, Content and Audience,' by tapping on them; you can switch between the three & can get the analytics about your Instagram profile.
Instagram insights offer different terms, numbers & graphs that help you enrich your marketing strategy. Understanding these metrics ensures effective lead nurturing & high conversion rates.
Let's dive into the insights to analyze the meaning delivered by the figures & how it can be implemented in the marketing effort by extracting the practical information.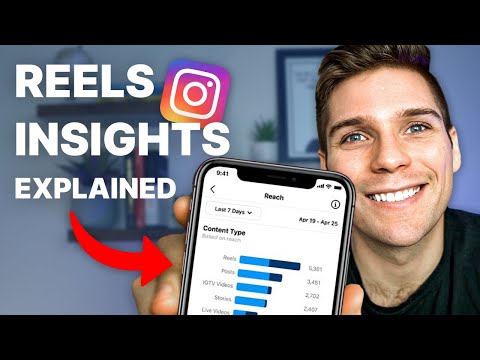
Under the 'Instagram Insights' tab, you'll find another tab containing three different information:
The 'Activity' tab encompasses the number of people who interacted with your content. It also measures the number of accounts your profile has reached with your Instagram posts.
The 'Activity' tab is broken down into two subsections of Instagram insights: Interactions and Discovery.
Interactions: This subsection of the insights tracks the total number of actions taken on your account in the past week. It offers metrics such as the number of visitors to your profile, number of clicks on the link on your bio, etc. Following are the detailed insights provided by the interaction subsection:
Profile Visits: The total number of users who have visited your Instagram profile.
Website Clicks: The number of Instagram users who have clicked on the website link in your bio.
Email: The total number of times users have tapped on email on your profile.
Call: The gross number of times users have tapped on call feature on your profile over the past week.
Direction: If you have listed an address on your profile, insights show how many of your followers have asked for direction.
Note: Using the graph, brands & businesses can monitor which day of the week has the most interactions. Also, you can compare the interactions from last week.
However, remember that this section of 'Instagram Insights' offers insights for a limited period, i.e., only to the past seven days. However, with Statusbrew Instagram insights tools, you can measure insights for an extended period.
Discovery: Discovery tracks & analyzes the total reach and impressions of your content for the current week. This section displays your content's overall performance and also tracks the effectiveness of your content. Discovery offers two prime metrics:
Note: Discovery helps you to draw a comparison between your campaigns. By tracking reach & impression, you can have the brevity about the efficacy of your Instagram account promotions.
It also helps you analyze if a specific content should be a crucial part of your social media strategy to reach out to your targeted prospects.
The activity tab reveals the influence of your page and details of how people have interacted with it.
Under the content tab of Instagram insights, you'll get the metrics relating to individual posts on your profile. Metrics offered by 'Content' insight include photos and video content, story & any promotional paid post published on your profile. The content tab is further split into Feed, Story & Promotions.
Feed: Feed Instagram insights under the content tab provide you with the analytics of your feed from the past two years.
It also empowers users to sort insights by content type, metric, and time period. You can filter the insights by the number of unique accounts that followed the CTAs, total number of comments on your post, engagement, follows, get direction, profile visits, reach & impression on your post, etc.
Story: Story insights subsection under the content tab provides you insights into your story's performance.
These metrics shed light on users' behaviors on your story, such as how they view and interact with your story. Story insights help you to shape & plan story content for the upcoming campaigns.
With story insights, you can access figures associated with the story such as impressions, reach, exit, replies, viewers, forward, backward taps for the next story.
Promotions: This section of the content tab of Instagram insights provides you the metrics associated with any promotions and paid ads you've published or had running on your account.
With promotion insights, you can view the number of 'Profile Visits' from your paid post & impressions, reach, and engagement on the posts. Furthermore, promotional insights also equip you with the audience demographics such as gender, age, and location.
Analyzing the promotion insights helps brands evaluate paid promotional campaigns and get in-depth ideas about which type of content can effectively reach the business goals.
Instagram insights' 'Audience' tab empowers you with a better understanding of your target audience. You get the overall details of your audience & their demography; and data on variation in followers' growth in the profile.
Audience tab provides you primary four key set of metrics such as:
Note: The audience section is one of the prime insights which can help build and improve your Instagram marketing strategy.
Along with understanding your segments of the audience who are your followers, it also allows you to decipher the time in which your followers are most active.
It is indeed beneficial to plan and schedule your Instagram post to reach possible prospects.
To stay one step ahead of your competitors, you can connect your Instagram profile to Statusbrew. It offers Sentiment Analysis, which helps you to analyze followers behavior. Also, assist you with data about average post engagement, helping you optimize engagement on your profile, ensuring maximize social ROI.
Individual post analytics on Instagram helps you observe how specific content or a particular message is resonating with your audience. Feed post insights on Instagram is a great way to analyze if your content is working well with your audience.
You can go with two different ways to access feed post analytics. The first way is through the Insights tab.
Step 1: Scroll to "Content You Shared" & tap on feed posts. It can provide your two years of feed post analytics based on a wide range of metrics: call button taps, comments, email button taps, follows, get directions taps, impressions, likes, post interactions, profile visits, reach, saves, text button taps, video views, website taps.
If you have enabled the 'Shopping' feature on Instagram, you can get even more metrics. Consider following this way to gain holistic view of content that has performed well in a specific period of time.
Step 2: If you are looking for a more detailed performance overview, tap "View Insights" below your published feed post. It'll give you access to the key metrics such as comments, sends, saves, interactions, i.e., profile visits, website clicks, accounts reached and followed, impressions including hashtags insights.
Each metric on the feed post provides relevant insights for your account. For example: likes, comments, and sent metrics help you to learn the type of content that motivates your customers to engage with your post.
Saves insights denote what content resonates deeply with your audience, ensuring a lasting value.
Website clicks indicate that your prospects want to learn more about your product or service.
Impressions denote your post-performance matching the Instagram algorithm. If on your feed post you are getting an impressive impression in the form of hashtags metric, it indicates that your hashtag formula is on the right track.
Like the Instagram feed post, you can access the Instagram story analytics through the insights tab. Instagram also allows users to get a story insights by swiping up on a live Instagram story.
Instagram story insights allow to get insights up to 30 days based on the metrics such as: back, call button taps, email button taps, exited, follows, next story, get directions taps, impressions, link clicks, forward, profile visits, reach, text buttons taps & website taps.
For a further detailed performance overview, swipe up on a live story. Then choose the insights icon on the left-hand side of the screen, where you'll find: Interactions, Impressions, Follows & Navigation such as Back, Forwards, Next story, and Exited.
Note: Impressions on the story calculates the number of times your Instagram story has been seen, whereas reach denotes the number of unique accounts that viewed your Instagram story.
Exited insight is the number of times a user swiped away from a specific story. Replies show the number of responses to a particular photo or video in your story.
Forward calculates the number of users that skipped the story post. Backward is the total number of followers that went back from the story post & 'Next Story' gives you insight into the number of taps to the next account's story.
Ensure to monitor the exited metrics closely, as these metrics indicate if your followers have lost interest in your story content.
Instagram reels are 15 seconds musical clips that are getting immense popularity. Brands & businesses also use this feature to enrich audience engagement. However, Instagram reels analytics are quite a new addition to the 'Instagram Insights' tab. Following are the steps to get reel insights:
Step1: Go to your Instagram business account & open the 'Instagram Insights' menu. There you'll find the reel tab. Tapping on the reel tab, you'll get up to 30 days' insights on your reel.
Step 2: Another way to access the Instagram reels analytics is to open a specific reel & tap the three-dot icon on the bottom right-hand corner of the screen. After that, choose "Insights."
Instagram reel insights include metrics such as Plays, Accounts Reached, Likes, Comments, Saves, and Shares. To enrich the reel analytics brands & businesses adhere to specific tactics:
Reels algorithm favors reels that are entertaining or which have a delightful surprise or twist.
Reel, which inspires to participate or starts a trend that others can easily participate gets more engagements.
The algorithm favors reels that use creative tools like text, filter, or camera effects & uses vertical video.
Be experimental with reels. Focus on trying something new. Try to create your brand's unique voice & for that, you must do a lot of research.
Note: Always avoid posting reels that are blurry due to low-resolution. Further, refrain from posting reels that are uploaded with a border around them. Also, never post reels that have the majority of the image covered by text. While posting reels, make sure to adhere to Instagram community guidelines.
Suggested Read: The Ultimate Guide To Instagram Reels | Get More Views Today!
IGTV feature on Instagram is the storehouse for longer-form video content. With this incredible Instagram feature, brands & businesses can display their products, share brand narratives or in-depth tutorials about the product feature.
Use IGTV to showcase content with which the audience can resonate & establish a long-lasting relationship.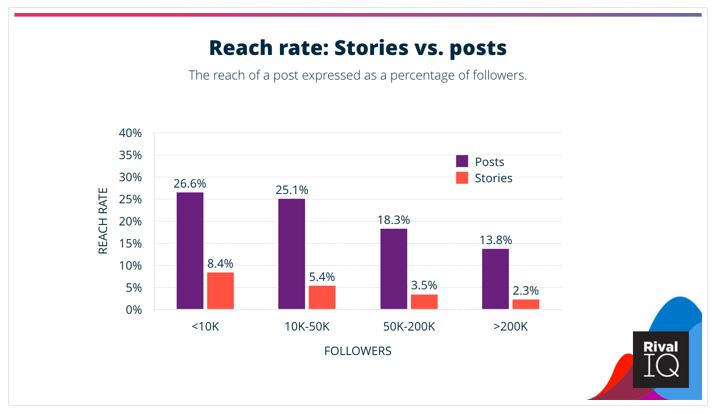
IGTV performance can be viewed through the Instagram insights tab. Instagram allows users to get the views of IGTV video performance for up to two years.
Step 1: To access IGTV data, scroll to "Content You Shared" & tap the arrow beside your recent IGTV videos. From this section, you'll be able to access the various IGTV performance metrics such as Average Percentage Watched, Comments, Likes, Reach, Saves, Video Views, IGTV Video Interactions.
Step 2: Tap the three dots at the bottom of a published IGTV video and select "View Insights" to dig into the insights for an individual IGTV video. It gives you access to the number of views, likes, comments and saves for your particular IGTV.
Analyzing IGTV performance by filtering the metrics is vital as, by this assessment, you get the data about which video is making your audience hooked and engaged. Based on the data, you can know which content you should continue & where there is room for improvement.
To view insights on Instagram live videos, you need to have a business or creator account on Instagram.
To access metrics on Instagram live video, navigate to the 'Insights' tab. On tapping on 'Accounts Reached' in the 'Overview' section, you'll get the IG Live analytics.
There's another way to access IG live video insights.
Step 1: Start your Instagram live stream.
Step 2: Right after the video is finished, tap 'View Insights'. In that way, you can get the analytics of the video. However, note that it may take a few moments for the metrics to load.
IG live insights comprise metrics such as account reached, peak concurrent viewers, & interaction metrics like comments and shares.
Account Reach: It is the metric for the total number of Instagram users who viewed your Instagram live stream.
Peak Concurrent Viewers: Concurrent viewers metric indicates the number of viewers watching your live stream at any given point. This number of viewers changes as viewers join or leave the stream. With peak concurrent viewers, you get the illustration at its busiest point of how many viewers were watching the stream.
Comments: It calculates the number of comments a live video received.
Shares: Share counts the number of times Instagram users shared your live video on their Instagram story or with another user.
Insights for IG live videos are available for the videos created on or after 2021-05-24 & more changes are on the way.
Across the globe, Instagram has 25+ million business profiles & 200 million Instagrammers visit at least one of the business profiles daily. Engagement with brands on Instagram is 10x higher than Facebook & 84x higher than Twitter.
The stats show that businesses are finding value in this social platform. But to uplift the Instagram bandwagon, you should know who views your profile or see your ads, how engaging your story & reel is, how your post is performing, and what value your account is actually driving.
Evaluating Instagram post insights is vital because:
Image Source: Starbucks/Starbucks Partners Instagram
Instagram Insights is a tool available on Instagram that allows 'Business Accounts' to analyze the progress. Following are a few ways to propel your Instagram insights scores:
 Engage Your Audience
The most effective way of increasing Instagram insights is to increase audience engagement. Audience engagement is a crucial element that makes the audience feel closer to the company. It increases their loyalty to a different degree.
Now, there are a number of ways in which you can engage your audience. You can frequently organize contests and giveaways, urging your followers to take part. You should further interact with your audience by promptly replying to their queries.
You should also ask your audience, from time to time, about their satisfaction with you, things they like about you, and suggestions they have for your company, while at the same time assuring them that their suggestions will be implemented in the best possible way.
View this post on Instagram
A post shared by KITKAT (@kitkat)
 Post High Quality & Relevant Content
The quality of your post defines your brand image. And most importantly, the quality of your post decides the popularity and number of sales of a particular product or service.
The most important thing is the standard of posts. Posts don't necessarily always have to be serious in nature; they can be fun at times. But fun doesn't mean resorting to cheap stunts and content. Always maintain a level of decency in your posts.
View this post on Instagram
A post shared by KITKAT (@kitkat)
Another significant parameter post needs to maintain in order to be successful is relevance. The audience needs to feel relevance and sense in your products and services in order to be attracted by them. Through Instagram analytics, you can find out the kind of content your audience relates with the most.
Developing a content strategy is an effective way to maintain a positive and relevant post timeline. A content strategy essentially defines benchmarks in relation to frequency, style, types of images and hashtags to be used, themes, engagement while creating a post. This helps you maintain a standard in your post while keeping in mind the kind of audience you relate most.
Instagram is a fast-paced existence. There are new accounts and posts coming up all the time. As everywhere, in Instagram too, recent posts move to the top of the feed. This means that newer posts have a higher possibility of being seen around the time they are posted.
Now, it is evident that your audience would not be online at all times, and it is equally apparent that, along with your account, your audience would be following other accounts. So, when they do come online, they will see the newer posts posted at that moment at the top of their feed.
You, hence, stand a chance to lose views in a situation like that. To overcome this you should take the help of analytics and find out when most of your target audience comes online. Like that, your post will come higher in your target audiences' feeds. You, hence, have a higher probability of being visible.
You should further schedule your posts, i.e., create your posts earlier and schedule the time on Instagram when they are supposed to be posted. Like this, you can ascertain that, even if you are not online or engaged otherwise, your posts will reach your target audience at the right time.
Including CTA in your feed post is an effective way to increase your online sales statistics. As compared to other forms of the post, a CTA post dominantly has a higher sales rate.
Call to action is the use of effective sales words, phrases, web pages, and messages, which compel the users to act in a specific manner, immediately, specifically directs them buying a product or to avail a service.
View this post on Instagram
A post shared by SanDisk (@sandisk)
It is a common practice among social media users to read bio very intently, more so in business accounts. You should, therefore, take special care in writing your profile bio.
You should write an attractive and captivating bio while being honest about your abilities, the services, and the products that you have to offer.
Include essential products you offer, along with important terms of services. Using relevant hashtags and keywords in your bio is an effective way of increasing views.
Also, captions in posts play an essential role in promoting the brand. Use short yet relevant and effective captions in every post. The caption should be appealing while at the same time defining what is in store.
Suggested Read: 350 Best Instagram Captions For 2021
View this post on Instagram
A post shared by Titan Watches India (@titanwatchesindia)
You should also make it a habit to post frequently and regularly. Posting frequently keeps you relevant in the minds of your followers, as well as Instagram algorithms. Your followers wish to hear from you regularly. So, cater to their needs as well.
You can make it a point to post user-generated content, for example, photos of products they buy from you. You can further give followers an insight into the working of your company or the people involved. This is a good way of appreciating the effort they put into following your brand; also, you never run out of content.
Your followers and customers are the ones you build your whole business upon. So, it is crucial for you to reciprocate swiftly. Be it a private message, or be it an issue with a comment, reply speedily, and resolve any issues promptly and effectively.
Image Source: boAt Instagram
Further, you can involve your followers in discussion sessions and contests, wherein you can encourage them to post photos related to your products and services.
Today, influencers are essential people in the social network. They are influential & Instagram users often rely on their feedback. They also have a good knowledge of content placement that generates high visibility.
Influencers further guide their followers which brands and products can be specifically beneficial for them. Major influencers have an extensive follower base and reach. You could use that to your benefit by collaborating with these influencers.
Image Source: The Food Network9 Instagram
Find out the kind of influencers you can associate with, according to your products. They can show the benefits of your products to their followers, urging them to try out your products and services. You could even conduct contests and giveaways through the influencers.
In the vast collection of a variety of posts out there, hashtags are an important way for users to find what one is looking for. When a user looks up a certain hashtag, posts with the maximum number of relevant hashtags show up higher in their timeline.
You should therefore use the maximum possible number of hashtags in your posts. This will ascertain that your post appears at the top of searches. While your existing followers will automatically view your posts with hashtags, your posts will be easily visible to new users.
Image Source: Statusbrew Instagram
Doing research on the kind of posts and topics that are relevant to your followers and other Instagram users of their age groups will help you to use the proper hashtags.
Further, research on what is trending, in general, will help you to implement hot topics into your posts.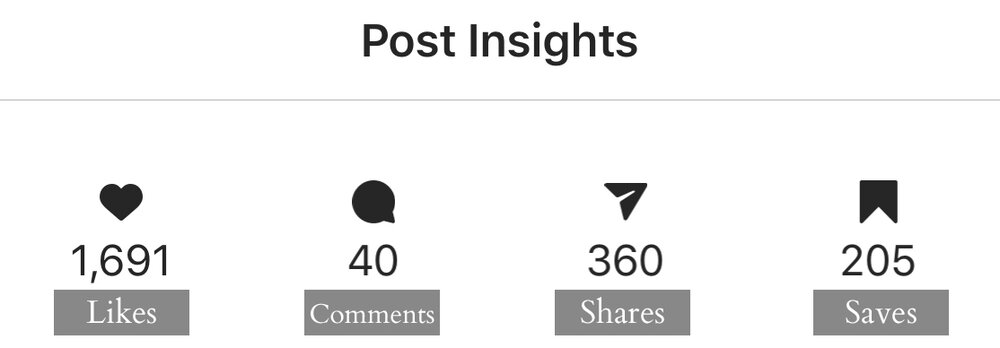 It will further add some more weight to your posts.
With Statusbrew, create content, manage marketing campaigns, monitor engagement & analyze performance to drive results.
Stay in line with your strategies and evaluate your efforts with on-point reporting for your Instagram metrics. Review and export reports on activity, performance, growth, engagement, and more.
Statusbrew Instagram Story Insights equips users to review your prospects' social behavior & interaction with the story published during a particular time period.
Build communities by replying to messages, comments, mentions, and ad comments. Moderate comments by hiding, deleting or marking as spam.
Have you tried Statusbrew for marketing on Instagram? Start your free trial today.
Start Today
Statusbrew is a unified Social Media Management tool that supports Facebook, Instagram, Twitter, YouTube, Linkedin, and even Google My Business!
.
Instagram account statistics could only be viewed using third-party services and programs, but now it can be done in your own account and even from a computer to Facebook in Creator Studio. Where is this statistics and how to do it on Android and iPhone?
Instagram statistics for the account as a whole, individual publications and Stories can be viewed for free, but first you need to create a business account or an author account. nine0003
👉 How to make a business account on Instagram
You will get statistics of the photo and the whole account after switching to a business profile or author account . You can do this for free. Previously, it was necessary to link the Facebook page. But now this can not be done.
But in order to run ads directly in the application, Facebook still has to be linked. To do this, you need to remember your e-mail and password from your Facebook account, as well as create a public page for your business account. nine0003
After transferring to a business account or an author account, you will see the inscription “View professional panel” and the “Statistics” button at the top.
If you immediately click the button, then you will immediately go to the Statistics of your Instagram profile.
If you click "View professional panel" - then you can see all the tools for working with a business account / author account. Including there will be a line "all statistics". nine0003
The third way to view Instagram statistics - in your account, click the three bars on the top right and select "Statistics"
Instagram account statistics can only be viewed from the current moment. Everything that happened before, no one will ever know =) Therefore, you will see some intelligible statistics for the entire account within a week, and only new posts will have photo and video statistics.
Statistics are needed not only to track the progress of an account, but also for potential advertisers who ask for the Reach and Engagement of an account before buying an ad. What does Instagram stats mean?
On the main screen, you can select the period from the top - statistics for the last 7 days or 30 days.
Accounts Reached - is the total number of people who saw your posts, Stories and IGTV) in a week, plus a comparison with last week. It differs from Impressions in that here each person (account) is counted only once, even if he watched your posts several times. Therefore, Reach will always be less than Impressions. nine0003
👉 Instagram reach: what is it and how to increase it?
Click on Covered accounts and more detailed statistics will open.
Subscribers and everyone else (by reach) - how many of the audience covered were subscribed to you, and how many were not.
Content type - which content received the most coverage (also broken down by subscribers and unsubscribers)
Here you can also see which posts were the most popular in terms of reach. And if you press the triangle bracket 9 on the right0013 > , then you can filter statistics on Instagram by other indicators (comments, likes, subscriptions, etc.).
Impressions is the total number of content views. One person could watch several times, different content. Therefore, impressions are always more reach.
Actions in the profile are visits to your Instagram account plus clicks on the buttons in the account header (email, store, phone, etc.).
YOUR AUDIENCE
Return to the first Instagram Insights screen. In the Your Audience section, click the triangle bracket on the right > . Statistics on subscriptions and unsubscribes on Instagram will open.
Increase - on this graph you will see the number of subscribers, unsubscribers and total (subscriptions minus unsubscribes).
Below are statistics by location, age and gender.
Peak periods - time (days and hours) when followers were most often on Instagram.
CONTENT YOU POSTED
Go back to the first Instagram Statistics screen. In the "Content you've posted" section, you'll see the number of posts/Stories/IGTV/Promotions in the last 7 or 30 days (depending on the filter on the top left). For each type of content, you can filter by all engagement indicators (impressions/reach/likes (likes)/comments/saves). nine0003
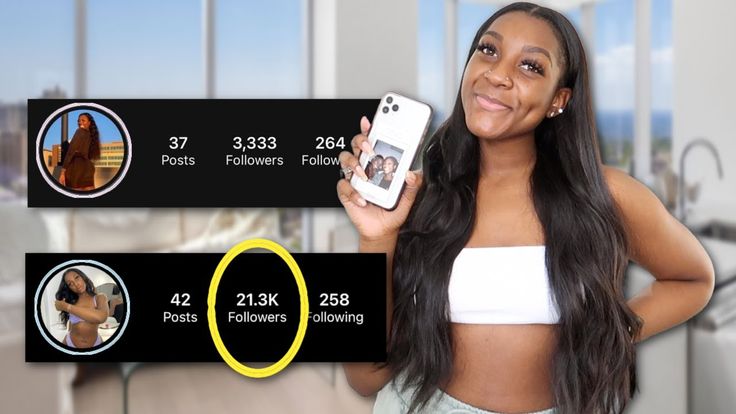
This will help you better understand the results of advertising from bloggers or giveaways. But this is only available for profiles with more than 10,000 subscribers. You can wind them up and go to the author’s account, especially if you don’t have enough 1000 subscribers and can’t wait to get new statistics right now. This will not hit the account engagement much. But ideally, of course, you need to grow organically, with the help of advertising from bloggers and targeting.
To find out the statistics of views (and not only) of each publication - photo or video on Instagram, you need to open the desired post and click "Statistics".
The top line of statistics is the number of likes, comments (👉 Comments on Instagram: how to talk subscribers), transfers to Direct and saves.
Saves - how many times the "save" button was pressed.
Visits to profile - how many times they went to the account from this photo. nine0003
Reach - how many people viewed the photo. On average, there should be 30-60% of subscribers. Less - a lot of bots that do not look at posts. More — if you ran an ad, got featured, the post turned out to be very popular, shared, etc. The larger your account, the smaller the reach in % of subscribers. Old followers abandon accounts or lose interest. This is fine. The highest coverage (in % of subscribers) is for accounts with up to 1000 subscribers. To increase your reach, be sure to post regularly, with a content plan. Even according to the coverage statistics on Instagram, you can understand whether you published a post at the right time or not. nine0003
If you swipe up on these statistics on Instagram, you can find out even more interesting things about the statistics of the post.
Profile visits - how many people went to your account after seeing this post
Reach - how many people saw your post.
Impressions - how many times your post was viewed. One person can view multiple times, so impressions are always more than reach.
From main page - how many people saw the post in the feed
From "Interesting" - views from the recommended tab, with a magnifying glass. The more, the more likely that the post has become "viral" (it is sent to friends, it appeared in the recommended). Also, a large percentage happens if you promoted a post.
From profile — how many people saw the post by logging into your account
From hashtags — how many came from hashtags
From “other” - all other sources
In a personal account, you can only see the total number and accounts of those who saw your Stories. To do this, swipe up from the bottom of any Story on Instagram.
After switching to a business or author account, you will have detailed statistics for each Instagram Stories. What does each statistic mean?
INTERACTIONS
Total statistics on the number of reactions to your Stories:
Replies — how many people answered you in Direct on this Story
Clicks on the link — how many times after this Story they went to your account and clicked on the link in the description.
Visits to profile - how many times after this Story they went to your account.
REACH STATISTICS
Here you will see statistics on how many people see your Stories and how they find them:
Accounts covered by this Story (Reach) - total number of people who saw this Story
Impressions - how many times this Story was viewed .
Subscriptions — how many subscriptions after this Story.
Navigation = back + scroll forward + jumps to next Story + exits0003
Forward - Number of taps forward to view your next Story
Next Story - Number of scrolls to the next account's Stories. Here you can understand whether was interesting or not was History , whether a person wanted to watch your content further or moved to the next account.
Exits — number of exits from the Stories view mode. Again, you can see the statistics of how the Story was able to keep the attention of subscribers. nine0003
Do not draw conclusions after the first week, how to connect free statistics on Instagram. Check how it will change for at least a month. Compare weekdays, weekends and holidays, good/bad weather outside.
Don't be in a hurry to "give it all away" if your coverage dropped in late spring and summer. Previously, no one had such statistics, and people who do not know the general trends in social networks and the Internet are afraid of fluctuations in statistics in their Instagram account. In the fall and after the New Year holidays, there is always an increase, and in the spring and summer there is an outflow. Of course, this does not apply to "seasonal" businesses (spring-summer travel agencies have growth, for example). nine0003
Even though many of us have a smartphone as an extension of our hand, we still scroll through Instagram less when we are on vacation, it’s summer outside, etc. Therefore, do not rush to arrange another giveaway or pour extra money on advertising if your coverage decline is seasonal. But do not abandon your account, if necessary, make pending posts for the holidays. Then even if you yourself are resting, you will still flicker in the feed of subscribers.
You will have the most reliable statistics a year after you make it. Therefore, it is best if you monitor your indicators on Instagram and write them down separately, noting what you did - cheating, advertising with bloggers, advertising (targeting), other promotion methods. nine0003
Those who use an Instagram* profile to grow their business and generate income need to feel their audience not only at the level of sensations, but also at the level of more accurate indicators.
Tracking the statistics of publications, you know exactly what content the audience prefers more, on which publications the live response from readers is more active, as well as what days and hours are best to post. nine0003
Gathered together ways to view and automatically collect statistics of publications on Instagram*, decipher metrics and options for improving performance. They also talked about a service that will make your analytics enjoyable.
There are two ways to connect and study Instagram* account statistics:
Posting statistics on Instagram itself* is only available in the business or Author profile. If a business profile has not yet been connected to your account, go to the settings, the “Account” submenu, scroll down to the bottom of the page and you will see the option to switch, the option is highlighted in blue. The whole process is described in detail in the article “Instagram Business Profile Guide*” on our blog.
After the profile is converted to business format, all statistics will be collected automatically. nine0003
DataFan can collect data from 5 social networks and 4 advertising accounts: Instagram*, VK, Facebook**, Odnoklassniki and VK Ads, Facebook* Ads*, myTarget, TikTok Ads. For them, internal reports of the service and templates for working in Google Data Studio are available.
You need to start collecting statistics of publications on Instagram* through the special DataFan service by connecting your account to the system. Select a social network in the data sources, the service will ask you to log in. In the future, connection to the account is carried out without additional authorization. nine0003 Selecting social networks and advertising platforms in DataFan
The selected report will appear in the "Control Panel" section in the list of connected publics and advertising accounts. You will need to wait until the information is pulled into the dashboard. But not for long, you hardly have time to pour a cup of coffee :–)
Connected publics and advertising accounts on the main DataFan panel Now you can analyze data inside the service and upload a report in JPG, PNG, PDF formats. You can also create a customized report in Google Data Studio or upload data to Google Spreadsheet or Power BI. nine0003 Instagram profile report fragment*
Please note that your profile must be connected to a Facebook page*. If your Instagram* account and Facebook* page are not linked by the same chain, the Business Profile Guide mentioned above has a detailed description of how to fix this.
The dataset in DataFan is information about one of your accounts. The system will download the data about the page on Instagram* once, the next time it will not be necessary to download it. Just select the desired set - your Instagram page *, create an internal template report and use it every day, the data will be pulled automatically. It will be just as easy to update them in templates for Google Data Studio. nine0003
So, the statistics began to be collected somewhere. Question: "Where?"
In the Instagram app itself* , post statistics can be viewed in several ways.
Three from the chest: three ways to view the overall statistics of the accountBut this article is about the statistics of posts, so we will go the other way.
Instagram post statistics*: go to any post, click "Statistics" under the photo/videoHowever, you can see the posting statistics on Instagram* in the general account statistics.
In the statistics, select "Covered accounts", scroll down and find popular publications. Here you can choose to show coverage or interaction with the publicationLet's find out what is encrypted under obscure icons and values. By tradition, we will first decipher the statistics of the post on Instagram * .
For convenience, let's divide the statistics page into three blocks to find out what the posting statistics on Instagram means*The first block includes four indicators:
The second block shows how many times users interacted with the post: they became interested and went to the profile or another action when placing this post as an advertisement. nine0003
Now let's decipher the third block of Instagram post statistics*. It reflects how many people see your content and where they find it:
So, the main metrics can be viewed and checked in the statistics of the application itself and entered manually into your data tables. But what to do when you don’t have time to collect data every day or the client requires full-fledged visualized reports instead of screenshots from Instagram*? For this, a special dynamic reporting service DataFan was created, which will eliminate the need:
We figured out the "Statistics" button under the post, now let's see how to find out the statistics of publications and stories on Instagram* via DataFan .
You can view the metrics in an internal report or create a data set in a template for Google Data Studio. It can be found under Connectors - Google Data Studio.
Report templates for Google Data Studio in DataFanIn the finished report, you can view statistics both for the account as a whole and separately for publications and stories.
Instagram post statistics* in the DataFan report Instagram story statistics* in the DataFan 9 report0279 The statistics of the standard instrument differs from the statistics collected by the DataFan service. The system tracks the reach and engagement of all publications for the selected period and provides you with the result of the analysis: the best post in terms of reach and the best post in terms of user engagement.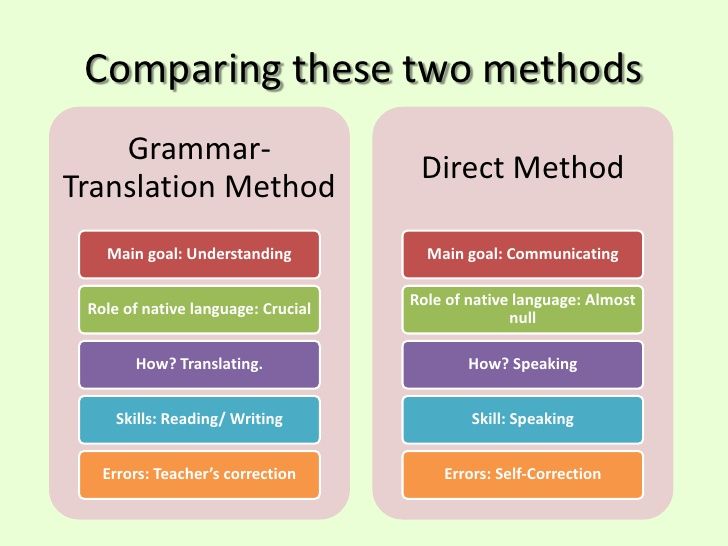 What is the advantage: the service will calculate everything for you, unlike the statistics of posts on Instagram itself*, where you have to track it manually.
You can read more about this in the articles “How to increase your reach on Instagram*?” and “How to calculate and increase engagement on Instagram*”. nine0003
In the DataFan report, you can see:
Using the settings in Google Data Studio, you can add and remove sections on the chart: for example, if you are not interested in the statistics of comments on Instagram posts*, then remove them from the general chart.
Let's summarize once again what are the key differences between the statistics in Instagram itself* and the statistics collected through DataFan: nine0262
The first thing you shouldn't do is rush into the pool as soon as you see your statistics, and it turned out to be not what you expected. Collect data for at least a month to clearly understand the picture. And for some accounts, statistics should be collected for at least a year. Consider the promoted product: if it is a seasonal product, for example, Christmas trees, then, despite other interesting content, the peak of activity will still be after September, and in early March. nine0003
As soon as you start collecting statistics on posts on Instagram* (and it will start collecting only after connecting a business account), pay attention to the following points: constantly - maybe, in your case, these will be posts with a link to IGTV with product reviews or videos about the provision of services;
What will this knowledge mean to you? A clear understanding of what your content plan for publications should be: you will know exactly when and what to publish.
If you're just exploring the world of Instagram business accounts*, you might think that your post reach should be close to 100%. This is not true. Coverages of 30-60% of the total number of subscribers are considered good.