Instagram Insights shows you engagement analytics that empower you to improve your Instagram for Business strategy.
You no longer have to guess about what works for your audience; Instagram Insights will tell you. You’ll therefore be able to get more likes, earn more followers, and grow your profile exponentially.
In this post, we’ll go over everything you need to know about Instagram Insights and how to leverage it to improve your Instagram profile.
Instagram Insights is a feature that allows Instagram Business Account users to see analytics related to their profile and posts. From this data, you'll be able to identify what your audience likes and engages with the most to improve your Instagram strategy.
Instagram Insights allows you to get access to important user engagement data for your business profile. It’s not just enough to know the raw numbers, such as the amount of likes you get for one post. It’s important to understand your audience, too.
That’s where Insights comes in. It tells you how they do things, what they prefer, and who they are. You can certainly make business decisions based on gut feeling, but you're much more likely to hit the mark when you can validate assumptions with cold, hard facts.
Data and analytics help you measure the impact of your marketing efforts across different channels to see if there's something you need to do differently — like target a different audience, post at a certain time of day, or experiment with a new content format.
Social media isn't any different from other aspects of your marketing in the sense that it can be measured and improved upon. That's why you'll be able to create a more effective Instagram strategy using Instagram Insights.
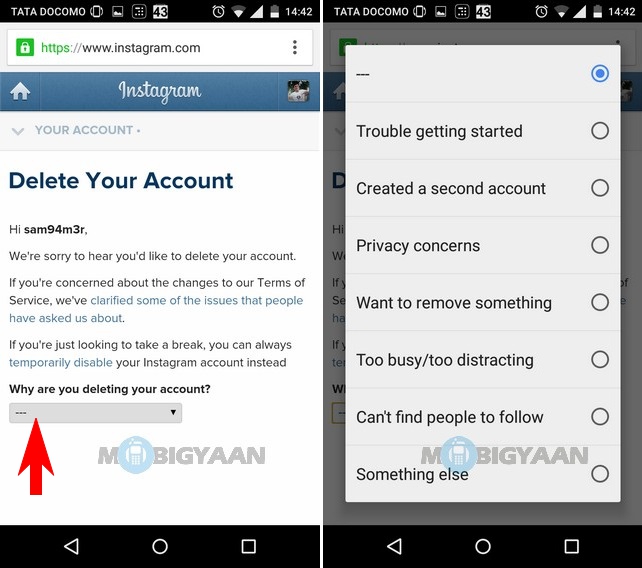
To use Instagram Insights, you must first have a business profile. The good news? If you're already using a personal account, you can switch to a business profile right from your phone. Here's how to convert your account in a few simple steps.
You can convert your Instagram profile to a Business account directly from your Instagram mobile app. First up, open up the app and click on your profile picture on the bottom right-hand corner of your feed.
Next, it’s time to head to Settings. On your profile, click the hamburger icon on the top-right corner.
On the pop-up, click “Settings.”
 Tap "Account."
A list menu will come up. Tap “Account.”
By switching to a Professional account, you can get access to Insights immediately — even if you’re not a business.
Choose the best category that describes you. Once you’re finished, click “Done.”
After, go back to your profile. Here’s what it will look like:
As you can see, you can immediately access Insights with a Professional account. If you’re a freelancer or content creator, you can stay as is, or you can take the extra step of switching to a Business account.
If you’re a business, organization, or brand, you’ll want to take the additional step of turning your Professional account into a Business account. A Professional account gives you full access to Insights, but is designed for independent digital creators. A Business account is more apt for companies.
Note that turning your account into a Professional account always comes before switching to a Business account.
To turn your account into a Business account, click the hamburger menu in the top right corner of your profile. Click “Settings,” then “Account.” At the bottom, click “Switch Account Type.”
Then click “Switch to Business Account.”
Done! You’re now a Business account with access to Insights.
Lastly, if you have a Facebook Business page, it’s important to connect it to your Instagram Business or Professional account. To do so, go to your profile and click the “Edit Profile” button.
Under “Profile Information,” click “Connect Facebook page.” Follow the prompts to connect your Page or create a new one.
Be sure to already have a Facebook account prior to connecting your page. Click here for instructions for setting up your Facebook Page if you don't already have one.
Once you’ve set up your Professional or Business Account, you can begin to use Instagram Insights.
Before we get into specific instructions for using it, however, here are the analytics on this channel that marketers need to know and understand — and how to use them.
Let’s look at Instagram Insights from a bird’s eye view and zoom in piece-by-piece.
Insights Overview is the “home page” of Instagram Insights. Here, you’ll see how you’ve fared overall.
You get several pieces of information on this page:

Now, let’s go into “Accounts Reached,” “Accounts Engaged,” and “Total Followers” in more detail.
In Accounts Reached, you’ll see more specific information about the users who have seen your content and interacted with your profile in some way or form.
Lets’ break down the different pieces of information you’ll find in this page.
 You can see the number of website taps, business address taps, call button taps, email button taps, and text button taps. For these metrics to show up, however, you have to have set up those buttons.
Accounts engaged refers to the number of users who interacted with your content beyond just watching it or scrolling past it. Let’s break down the sections on this page.

The total followers page of Instagram Insights allows you to see the total number of users who follow you. You can also see follows, unfollows, top locations, age ranges, and genders.
Under total followers and its demographic breakdown, you’ll then see one more section: most active times.
To see post insights on Instagram, navigate to your Instagram profile and click the button that says “Insights” right above your posts. Alternatively, click the hamburger menu on the top right-hand corner and tap Insights. There, you’ll be able to see Insights for all of your posts, reels, live videos, and more.
Next, let’s go over how you can see insights for individual posts on Instagram.
If your Story is currently live on your profile:
If your Story has already expired or more than 24 hours have passed:
If you’ve just finished your Live video:
If you broadcasted your Live video in the past:
Next, we'll get into how to use Instagram Insights in your day-to-day.
Instagram Insights is a fantastic tool, but it can be hard to know what to do once you gain access. Here are some of the most useful ways you can use Insights as you grow your Instagram profile.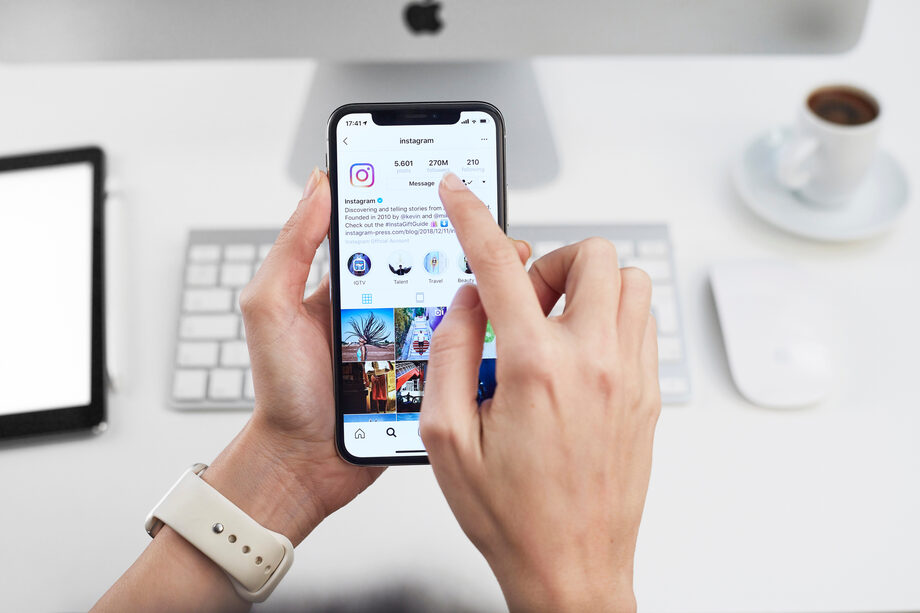
Click the Accounts Reached section. As mentioned, reach reflects the number of unique users that have seen any of your Instagram posts.
Within this category, you'll see insights for:
Some of these insights can be expanded for more insights.
On the Accounts Reached page under Account Activity, you'll be able to see Profile Visits.
Profile Visits reflects the number of times your profile has been viewed.
Find out how many of your profile visitors are turning into followers by dividing your number followers by the number of visitors. Track this number over time to find out whether your “conversion rate” is increasing or decreasing.
Website Taps can also be found under Accounts Reached > Profile Activity. This insight reflects the number of times any links you've included in your business profile have been clicked.
Navigate back to Insights Overview and tap Accounts Engaged. This will bring up a page that shows how your content is performing in terms of engagement, breaking down the metrics by content type.
Likes speaks for itself, reflecting the number of users who liked your post. As with likes, Comments reflects the number of comments left on your post. Saves highlights the number of unique users or accounts who saved your post. If any of these numbers are low, it’s important to reevaluate your Instagram strategy.
Navigate back to Insights Overview and click Total Followers. You'll then reach the Follower Breakdown page.
This page reflects how many followers you've gained or lost over the past week, as well as the average times of day when your followers are using Instagram — data that can be highly beneficial when planning posts.
To view insights for a specific Instagram post, start by visiting your profile. Tap on the post you'd like to look into, then click View Insights below the image
Under the “Profile Activity” section, you’ll find out the number of actions that users took on your profile as a result of seeing your post — things like visiting your profile, then taking an action like clicking on your website link or following you.
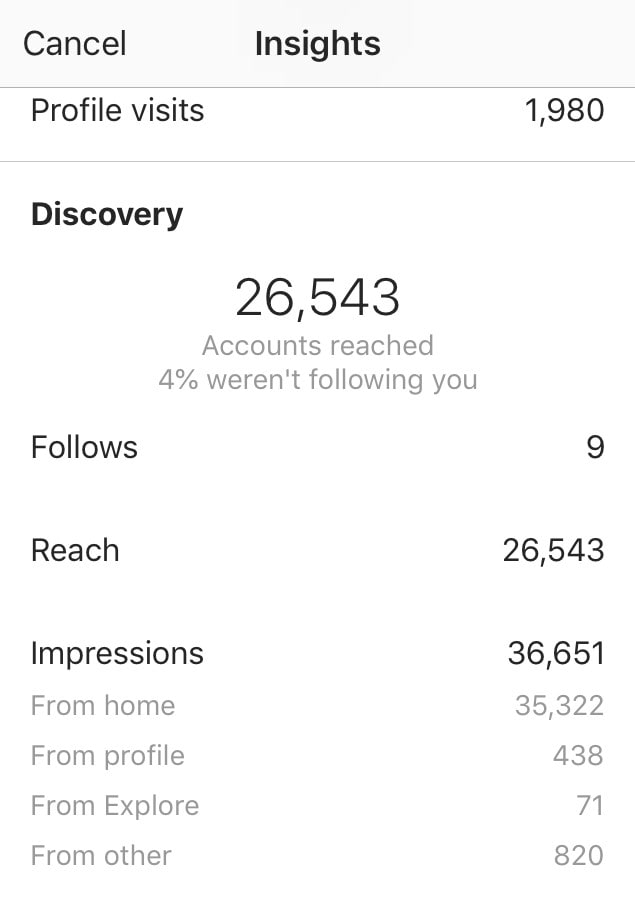
Previously named “Discovery,” Reach indicates where your post was seen — or discovered — the most, including how many accounts weren't already following you when they first saw the post.
This section includes metrics on Impressions, which reflect the number of times your post was discovered from a particular place within Instagram, like the user's home feed, a search, your profile, a location tag, or a hashtag.
Reach insights also include data on a post's reach — which reflects the number of unique accounts that saw your post.
Instagram users with a business profile are able to view insights into their ephemeral Stories.
To view your Story insights, navigate back to Insights and scroll down to Content You Shared section on the Insights Overview page.
Scroll down to the Stories section, and you'll be able to see insights for older stories, as well as any that have not yet expired.
Next, we'll get into the more specific insights you can explore.
This insight represents how many times your Story was seen.
When viewing these insights, keep in mind that you're able to add multiple images or videos to your Story. When you do this, every piece of visual content in your Story is counted as a single photo or video in your post.
Let's say you add six photos to your Story. Whether someone only views one or views all six, Instagram only counts your entire Story having received one impression.
The same goes for Story content that has been viewed by a single user more than once. Instagram still only counts that interaction as the entire Story having received one impression.
This insight reflects the number of unique users that have seen your Story.
This insight reflects the number of times a user taps your Story photo or video to skip to the next piece of media.
This insight reflects the number of times a user taps your Story photo or video to go back to the previous piece of media.
This insight reflects the number of times users send messages through the Send Message text box on your Story.
This insight reflects the number of times users swipe to skip to the next account’s Story — not to be mistaken for "tap forward," which reflects users skipping ahead to your next piece of Story media.
This insight reflects the number of times a user leaves the Stories section entirely to return to the home feed.
Now that you know how to access data to inform your strategy with Instagram Insights, you can analyze that data and determine what's working for your audience (and what's not). From there, creating content that gets a ton of engagement will be a lot easier as you consider those benchmarks.
Editor's Note: This post was originally published in January 2018 but has been updated for comprehensiveness.
Topics: Instagram Marketing
152
SHARES
This post is also available in: Français (French)
Post content
 1 What is Instagram?
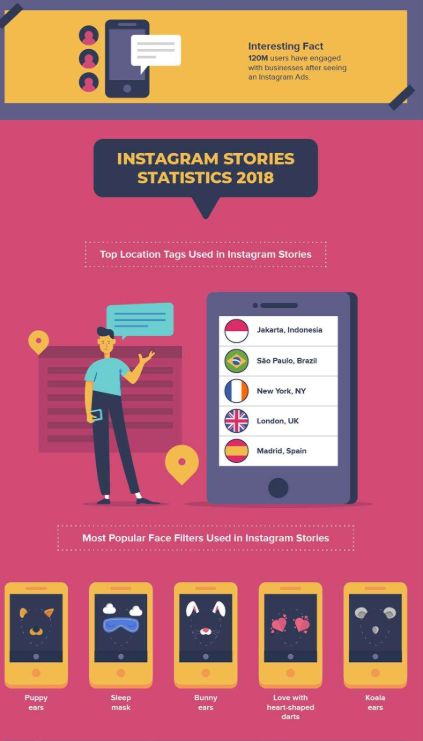
The more social media networks grow the more opportunities they collect. Social media is a gold mine of opportunities when it comes to brand awareness. Nowadays, brands are all social media-oriented because they know how useful it is. It doesn’t matter if you’ve got a small company or a multi-billion company. There are some companies out there who grew their business with social media only. They grew their sales, had a larger exposure with time and grew their company in the process. In this post we will learn about Instagram in particular. Have you ever heard of Instagram impressions? If you want to know more about them, keep reading this post. But, if you don’t like Instagram and you want to start creating your own Twitter reports, click on the following button:
Create a FREE Twitter report
That’s how powerful social media is, and that’s why you should think about using it. Now one of the most famous social media networks is Instagram. We can see that nowadays Instagram is slowly growing and adding unique features by the year. So, a lot of businesses moved their attention from Facebook & Twitter only to Instagram as well. If you’re one of those businesses then you’re at the right place. With this guide, you’ll be able to understand what Instagram is and how to analyze it for your own advantage.
Instagram is a social network that was built in 2010 that was photos and videos oriented. It was first available only in iOS but then it became available in 2012 for Android as well and it was purchased by Facebook in the same year.
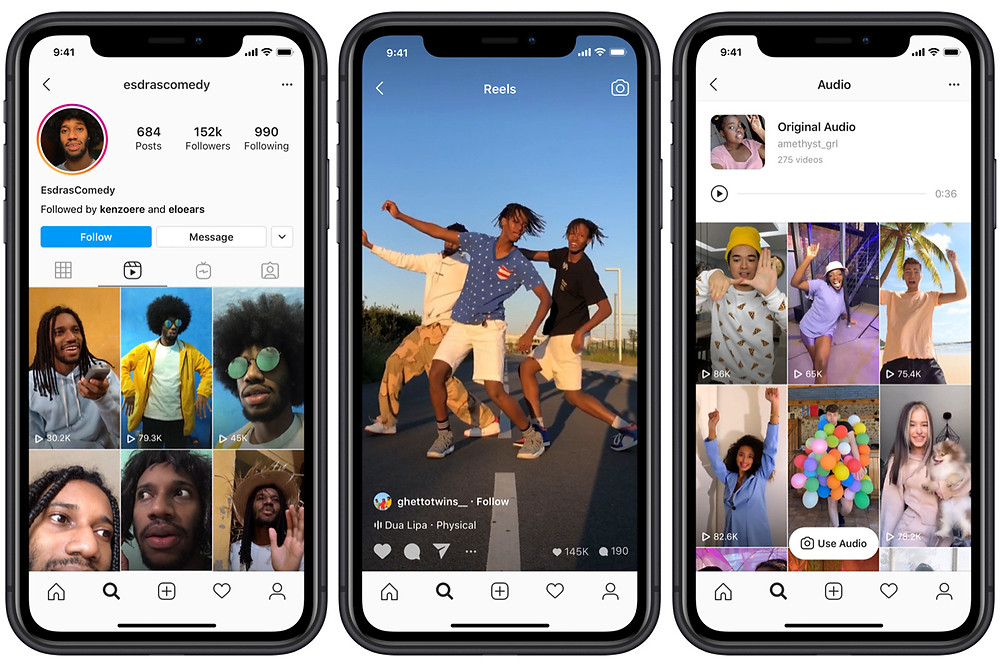
Instagram allows you to follow people, to be followed back, to post pictures, like other people’s pictures and to have a feed of your own. Your feed on Instagram will show you the latest posts of your following list and their stories as well.
Instagram has many features which are:
You’ll first have to sign up to start using it. You can either sign up using your Facebook account or sign up using your email address and so on. Before you sign, you’ll have to download the app which is available for both Android and iOS.
There is also an app for windows 10 or a desktop portal for desktop owners, but it’s quite limited. You can not upload any pictures or videos from it, you can only scroll through your feed, search for things and so on.
There are two kinds of profiles on Instagram, the business one and the personal one. If you’ve got a business account then, obviously you’ll need the business one since it has more features that you can unlock.
One of those features is Instagram insights (also called Instagram analytics). It’s an analytic tool that provides you with data and information about your account. It allows you to find out how many impressions you’ve got, your reach, your follower demographics and so much more.
Just like it’s been said before, in order to access Instagram Insights, you’ll first have to switch your personal account to a business one. Doing that will allow you to get access to all kinds of data. There are three different places on Instagram where you can access your data. Users can access your data from your images and videos by clicking on view insights that appear at the bottom of the post.
Access your story’s insights by swiping up and checking how many people have seen your story. A user can even see how many people forwarded it, how many people swiped next, how many people found their story from hashtags, and how many people visited their profile after seeing their story. And users can also access their insights from their account page. By clicking on the top right of your account; they’ll be given various choices including statistics where it has a graph icon.
Users will be redirected to their analytics in no time, and in there they’ll find all sorts of data. You can find out how many people checked out your account and how many views you’ve got in the past week. You can also find out how many followers you’ve got and how many people followed you in the past week.
Instagram Insights allows you to find out the number of Instagram impressions, reach, website clicks and CTAs clicks of the past 7 days. It also allows you to find out how many posts you’ve got in total and how many were added in the past week.
Now that you know what Instagram Insights are it’s time to learn how to use them. Go over to your Instagram Insights and all you’ve go to do is click on the audience section that is on the far right. If you click on it then you’ll get a summary of your audience’s demographics.
You’ll first learn where most of your audience is located by country and city, then you’ll find out their gender, and their age group by gender. You’ll also be able to find out the days and hours where they’re most active and available for a maximum of reach. You can even analyze Instagram in real time.
This information helps you to better understand who your followers are and where they’re from so you can assess whether you’re reaching your target audience on the platform or not. You can find out how to impress more audience by targeting special days or hours, or you can find out if you’ve got more female audience than men and how to use that for your advantage.
We often think that reach and impressions are the same thing and use them for the same context. But that’s not true. Reach and impressions are totally different things and their meaning changes from a platform to another. What Facebook considers as impressions are referred to as reach for Twitter. And so on, so they shouldn’t be mixed and they shouldn’t be used in the same way for all platforms.
There are many Instagram metrics that need to be taken into account when analyzing a campaign. A total number of posts, users who have posted, engagement… But there are two main metrics that are key to understand the performance of a campaign: Instagram reach and Instagram impressions.
These two terms may seem that they mean the same but they don’t. Whereas reach stands for a number of people, impressions stand for a number of times. Both metrics are potential. Instagram impressions are the potential number of times someone could have seen the posts shared with the analyzed Instagram hashtag.
For example, imagine that a user has 200 followers and has posted 3 pictures using the analyzed hashtag. Then the potential impressions he has generated are 600 (3 posts multiplied by 200 followers).
Instagram reach is the number of unique accounts that have seen the post. This metric is also an estimate and may not be exact. This is because there is no way of knowing if someone has effectively seen the post as everyone is scrolling up and down their screens.
So, in short, if an account has 200 followers, then its potential reach is 200.
As was aforementioned, checking impressions on Instagram is very easy. You just need to go to the insights dashboard and there you will have all the metrics together. You can go over to the activity dashboard, scroll to the bottom and that’s where you’ll find the impressions. If you want to see the Instagram impressions of the latest picture you have posted just go to that picture and click on insights. On the bottom right you’ll find out how many impressions your post has gotten. That’s how easy it is!
If Instagram Insights were not enough for you to measure impressions then Tweet Binder is there for you. Tweet Binder is an Instagram tracker with statistics that are very easy to analyze and understand. You can now find out user rankings and most liked publications and so much more. You can get access to thorough data analysis and detailed statistics in no time. Find out your potential reach, impressions, impact and economic statistics with our tool.
Tweet Binder analyzes any hashtag on Instagram. The stats included in the report help to have a good overview of how the hashtag has evolved on Instagram. One of the most demanded stats are Instagram impressions. Instagram impacts are calculated by multiplying the number of followers an account has by the number of Instagram posts they have sent. Once this has been done with each user, the system adds those figures to get the total number of potential Instagram impressions.
If you want to know more about our Instagram hashtag reports, you can visit our website. You’ll be redirected to a page where you can confirm your payment and where you’ll receive your data. Once that is over you’ll be able to gain access to this kind of analysis:
General Instagram analytics of a Tweet Binder Instagram report – Instagram impressions includedInstagram is one of the most used Social Networks and that is why it is so important to analyze every Instagram campaign. Stats such as the reach or the impressions help brands and agencies to know if the event has been a success or not. While Instagram reports are very used worldwide. However, if you want to give Twitter a try, follow the next button and create your free report:
Create a FREE Twitter report
152
SHARES
Statistics on Instagram allows you to analyze:
 Analysis of statistics will give you a better idea of subscribers and their preferences.
 The result of the analysis is a change or addition to the account promotion strategy. Making adjustments to the content plan, deciding to launch targeted advertising, or choosing a more appropriate time to publish posts.
Reduce the budget of targeted and contextual advertising with click.ru
Click.ru will return up to 15% of advertising costs.

Cut the budget >> Advertising
The main thing is to be able to "read" the data, as well as draw the right conclusions from them. The success of your personal blog or business page directly depends on this. In this article, we will tell you where to find and how to view statistics on your Instagram profile. Consider the process of analyzing each indicator: what it means and how to improve.
Read more
Expand the menu of the main page of the account with the button with three bars (in the upper right corner of the screen).
In the menu that opens, select "Statistics".
You will see a page with 3 tabs.
What can be seen on each:
 All posts will be here. You can compare coverage or see more detailed indicators for each.
Below we will look at the contents of these tabs in more detail.
Data for a specific post can be viewed in two ways:
Method 1 . On the account metrics page, in the Content tab, select the post you want to post.
Method 2 . On the main profile page, select any publication, and then click "View statistics" under the photo.
Thus, you will find yourself on the publication statistics page:
Below we will take a closer look at the data content for specific posts.
Article in the topic : What is ER on Instagram and how to calculate it
We have already posted an article about the analysis of stories statistics. Now let's focus on the analysis of the indicators of specific posts and accounts in general.
Let's take a closer look at each section of statistics:

To analyze publication statistics, it is possible to filter posts by indicators. On the account metrics page, in the Content tab, click the All link. Next, select the filtering options from the drop-down lists.
You can filter by publication type, period, and measure.
The data is located on the account statistics page in the Actions tab.
The data is located on the account statistics page in the "Actions" tab.
Located in the Audience tab of the account statistics page.
 Presented in the form of visual graphs. Allows you to identify the best time to post on Instagram.
 Read also : The best services for working with Instagram
Analyzing account statistics and specific profile posts is a very useful tool for planning a personal or business blog promotion strategy. The right conclusions from tracking the dynamics of the page indicators allow you to make it better: increase the audience, increase the reputation of your personal brand and sales.
Comparison of online courses
Before you buy any course, compare the conditions from different schools - tuition fees, discounts, duration, whether there is an employment program. Find an online course >>
Advertising
More articles on the topic:
Advertising
Advertising
Home
Blog
What is Instagram reach and how to increase it
Gone are the days when the fight was for followers, it's time to fight for reach. The greater the reach on Instagram, the more fans on your blog, potential buyers or advertisers. Let's figure out how to view coverage, analyze it correctly and increase it.
How reach differs from impressions on Instagram
How to view reach on Instagram
What depends on the coverage on Instagram
How to increase coverage
How to increase coverage
FAQ
What is the difference from impressions on Instagram
to begin with, we will sort it out, which means coverage on the Instagram Statistics and how it differs from shows.
Reach (reach) is the actual number of people who have seen certain information in your account. This can be a post, stories, the account itself, or an advertisement. It only takes into account unique visitors, so repeated actions by the same person will not be counted.
Impressions /Views (impressions) is the total number of views on your post/stories/account. That is, one user can view the same post / stories several times or log into the account.
For example, if one person has seen your post three times, this will count as 1 post reach and 3 impressions. Impressions are always greater than reach.
How to see the reach on Instagram
You can see the reach of your account, posts and stories in the internal statistics of the Instagram application, but only for 30 days. This is not enough to evaluate the growth of an account in dynamics and find weaknesses that pull the reach down.
To get extended coverage statistics and compare indicators from month to month (retrospective from 1 to 5 years), add it to monitoring in LiveDune. Next, go to the "Coverage" tab and select the desired period for analysis using the calendar in the upper right corner. A breakdown of each metric with examples can be found here.
What determines reach on Instagram
Due to the algorithmic feed, only those subscribers who interact with your content or account see your posts: read posts (spend a few seconds on a post, scroll through the carousel), watch videos or IGTV , like / comment / save / repost, write to you in Direct, watch and reply to stories, go to the profile. At the same time, the interaction should be repeated - Instagram takes into account the historical interactions of one account with another. Therefore, in order for subscribers to leave reactions to posts and stories more often, the content should meet their interests or touch on relevant topics. It is also important to periodically apply game mechanics and polls in stories.
Post length, publication time, and geolocation are additional ranking factors. And if the publication is liked by a large number of subscribers, then it is most likely to be shown to other less active subscribers.
There is also a chance to get into the recommendations, here the algorithm looks at your interests by topic, as well as how popular the post seems to be - how quickly the post collects likes, comments, reposts and saves.
How to increase coverage
The main secret of high reach is constant analysis. This allows you to understand what topics, formats subscribers respond better to, and what they leave unattended.
Explore the top posts by reach. Analyze the posts and try to understand how they differ from others. For example, in a post you raised a hot topic for subscribers and at the end asked for the opinion of subscribers, thanks to which you received a lot of comments. Or they published beautiful photos of attractions, and in the text they described how to get to them, and the post received a lot of likes and saves.
Then analyze which posts received the least coverage. This will create a complete picture of which posts should be excluded from the content plan, and which ones, on the contrary, respond better to subscribers and can be published more often. You can view the top posts in the table on the "Posts" tab in LiveDune, to do this, click on the icon with coverage in the table once (down arrow).
Experiment with post formats. Try posting more carousels and videos rather than just images. Carousels, first of all, are good because they are shown in the feed as many times as there are slides in it (for example, 4 slides - 4 times the carousel can appear in the subscriber's feed). And the subscriber spends more time watching a video than a regular post with an image, which gives a chance to increase the desired reach.
You can evaluate which post format the audience responds to best on the Posts tab ― Post Types graph. Similarly, analyze the posts of competitors, see which format suits the audience better. But be sure to pay attention to the topic and visual of the posts, as well. the secret of success may be in them, not in the format.
Post when your followers are online. Analyze when most of your followers are online and adjust your posting times to increase your reach. To do this, on the "Audience" tab, study the "Online Followers" graph. Inside the squares will show the number of subscribers who are online on a specific day of the week and hour. The recommended hours for posting are marked in pink, in which the chances of increasing coverage increase.
How to increase your reach is not possible
In an attempt to increase your reach, many people start posting more often. This method, although it works, is short-term, because increased posting usually entails a decrease in the quality of content and rapid burnout. It is more correct to increase coverage by improving the quality of content. Then subscribers will respond better to posts (like, comment, save), and raise the algorithmic feed in the search results, so the coverage will quickly grow.
You can see the average reach of a post on the Reach graph. Hovering over the desired month will display the average reach of the post. And the blue dotted line will show the dynamics of the “Average Post Reach”.
Each user is counted in the weekly coverage once, while he could watch your posts every day. Therefore, in the sum of coverage for seven days, the user could count up to seven times. The situation is similar with the monthly coverage.
Daily reach means that N users were reached on D-day. And post reach on D day means the sum of the reach of all posts published on D day.
It is incorrect to compare these metrics, because the coverage of the account for the past dates does not change, because. new users are counted in today's coverage. But the amount of coverage of posts published over the past date may increase due to new users.
"D-Day" can be changed to any period.
Only important news in the monthly newsletter
By clicking on the button, you agree to the processing of personal data.
What's new in SMM?
Subscribe now and get an Instagram account audit guide
Popular articles
≈ 10 min to read 02/08/2022
What Instagram trends will be popular in 2022
What to pay attention to in order to be in trend: design, visual and content, and what is better to refuse.
≈ 12 min to read 11/11/2021
Instagram account audit using LiveDune
An Instagram account audit will help you prepare or adjust your content strategy, find insights, and correct mistakes.