BlogOct 25 2022
by Keyhole
When tracking any social media metric, it’s best to think in terms of rates and percentages rather than raw numbers.
Rather than tracking the raw number of social media followers you’ve gained or lost, tracking your follower growth rate is much better. Before we jump into follower growth rate calculators, let’s look at exactly what this metric is.
Table of Contents
Follower growth rate, expressed as a percentage growth, measures the speed at which your social media account is gaining (or losing) followers relative to your previous follower count.
For example, your monthly Instagram follower growth rate would be the percentage growth your follower count has seen since last month. A higher growth rate means your marketing team is on the right track, launching intuitive and engaging campaigns. At the same time, a dip might need some optimization tweaks.
Tracking a raw increase in follower count doesn’t tell you as much about how quickly you’re gaining followers as your growth rate does.
Keyhole is a real-time conversation tracker that provides keyword + hashtag analytics and social media analytics across platforms such as Facebook, Twitter, and Instagram. Get started for free here.
The follower growth rate serves as a better health check on the performance of your campaigns. Tracking this rate can help you monitor your performance against your competitors. For example, you could have fewer followers due to having a newer account, but you could be gaining traction much faster than they are.
Book A Free Demo
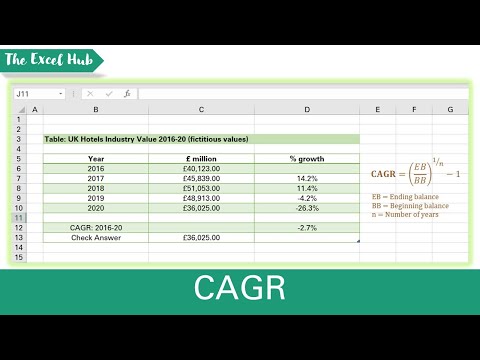
The follower growth rate is calculated as the number of followers you gained divided by the number of followers you started, times 100% (over a specific time period).
The follower growth rate calculation is:
Follower Growth Rate = New Followers / Starting Follower Count x 100%
For example, if Company A starts with 1000 followers and gains 100 followers in a month, they’ve achieved a growth rate of 10%.
Contrast this with Company B which starts the month with 10,000 followers and gains 100. That’s a growth rate of only 1%.
Although both accounts gained the same raw number of followers, Company A is doing a much better job at attracting new followers—their growth rate was 10 times faster relative to their original size.
Now you can feed in the formula given above in spreadsheets and create your own follower growth rate calculator.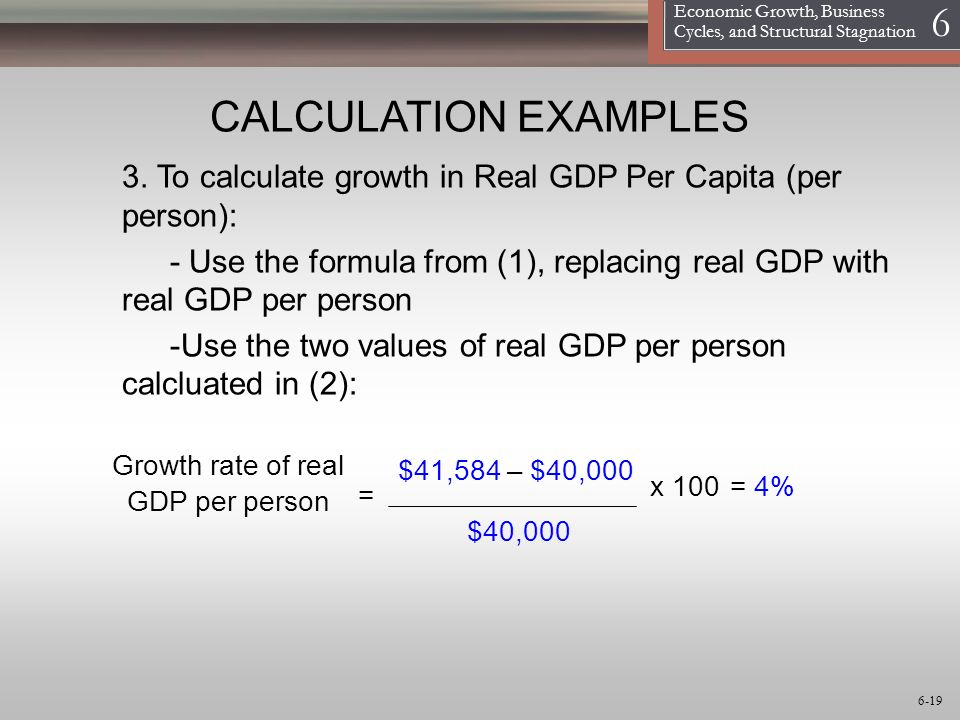 But even that might add to your work pile! That’s why we suggest you try out Keyhole, a complete social media analytics tool.
Right from brand monitoring and profile analytics to hashtag tracking and sentiment analysis, Keyhole has everything you need under one roof. To easily track and report on your growth rate—and that of your competitors—start your free Keyhole trial today.
Follower growth rate, expressed as a percentage growth, measures the speed at which your social media account is gaining (or losing) followers relative to your previous follower count.
Follower growth rate is calculated as the number of followers you gained divided by the number of followers you started, times 100% (over a specific time period). For example, if Company A starts with 1000 followers and gains 100 followers in a month, they've achieved a growth rate of 10%.
Keyhole is a good social media analytics tool.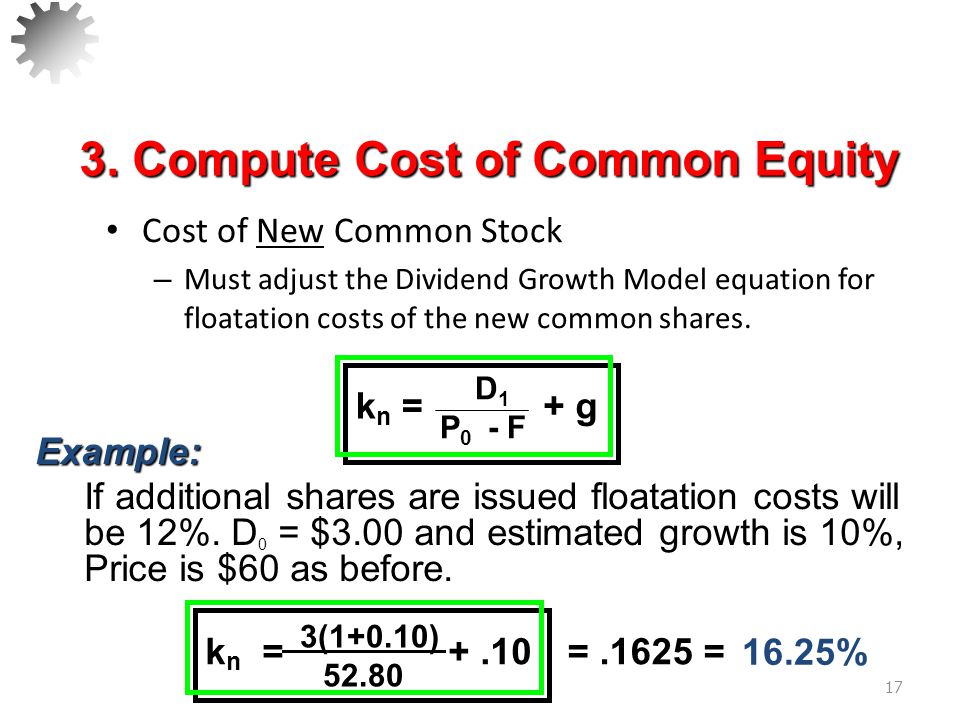 Add trackers and profiles to its dashboard, and Keyhole will pull in detailed metric analysis in no time. You can even download and share them as reports for marketing ROI overview.
Related Articles:
The Top 5 Social Media Strategies For Marketing Success in 2020
How to Get More Instagram Followers: 30 Proven Strategies
Each month we publish the average Instagram Growth Rate benchmark based on the hundreds of thousands of Instagram Professional Profiles (Business & Creator profiles) from all around the world indexed by Social Status. Data comes from our Profile Analytics tool which enables performance tracking of Business and Creator Instagram Profiles.
The average Growth Rate on Instagram last month was:
This chart shows the historical monthly Instagram Growth Rate for the past year. As you can see, the monthly average is seldom static so its important to benchmark your performance on Instagram against the monthly average. Use Profile Analytics to benchmark your Instagram Professional Profile and track your growth monthly (please note: personal Instagram profiles can not be tracked).
Growth Rate is a simple calculation in the increase (or decrease) between two numbers. In this instance, the number of Followers of an Instagram Profile.
Since this is a monthly benchmark (and that most marketers benchmark monthly), the Monthly Growth Rate calculation is the difference between the Instagram Followers on the first day of the month compared to the last day of the month:
Monthly Growth Rate = (Followers on last day of month – Followers on first day of month) divided by Followers on first day of month.
As an example, let’s say your Instagram Profile had 5,293 Followers on March 1 and 5,428 Followers on March 31. The Growth Rate for the month of March would be calculated as:
5,428 minus 5,293 = 135
135 divided by 5,293 = 0.02550
0.02550 multiplied by 100 = 2.55%
We multiply by 100 in order to get to a percentage. Growth Rate is usually expressed with 2 decimal places.
Growth is a tricky thing on every social media channel, especially Instragram. But thankfully, there are some tactics you can use to drive growth if you need to grow your followers:
 Just check your local laws as to whether you need a permit to run a game-of-chance giveaway
And recommendations from Russian experts.
140 625 views
Amplifer's content marketer Alexander Marfitsin prepared an adapted translation of an article from Buffer's blog about Instagram analytics. He also asked experts about how the data obtained can be used to optimize advertising campaigns on the social network.
Analytics is an important part of any social media marketing strategy. It helps you understand how successful your campaign is, track performance, and answer important questions.
It also gives a lot of useful information. In this guide, we'll take a look at what Instagram analytics metrics and features are, what free and paid tools you can use to explore your data, and how you can use them to improve your Instagram analytics performance.
Basic statistics
Instagram has many metrics that help you understand campaign performance and page management strategies. These metrics can be obtained from Instagram Insights and other analytics tools.
Most of the available metrics can be thought of as basic metrics like the number of likes, comments, and followers. Below we will tell you how to calculate more complex indicators: growth, averages, coefficients.
Instagram Profile Analytics Metrics
Number of followers: is the number of users following the account.
Impressions: total number of views of all publications.
Reach: number of unique users who have seen the posts.
Profile views: number of profile views.
Clicks on links: number of clicks on the link in the profile description.
Call and email clicks: number of taps to call a phone number or write a letter in the profile description.
Posts: the number of posts posted on the Instagram account.
Mentions: number of publications in which the profile is tagged.
Branded hashtags: number of posts on Instagram using the branded hashtag.
Audience analytics metrics
Gender: distribution of subscribers by gender.
Age: distribution of subscribers by age. Divided into categories: 13-17, 18-24, 25-34, 35-44, 45-54, 55-64, 65+.
Geography : five most popular cities and countries in which subscribers live.
followers activity by day and hour.
Publication Analytics Metrics
Impressions : The total number of times the post has been viewed.
Reach : The number of Instagram users who saw the post.
Likes : number of unique users who liked the post.
Comments : number of comments on the post.
Saves : Number of unique users who saved the post.
Engagement : The sum of unique users who liked the post, saved it and commented on it.
Views : Number of video views.
Stories metrics
Impressions : The number of times a particular photo or video has been viewed in Stories.
Reach : The number of unique users who saw a particular photo or video in Stories.
Exits : The number of times users closed Stories.
Replies : The number of subscriber replies to a particular Stories post.
The best Stories analytics tool right now is Instagram Insights
Live analytics
Number of viewers at the time: number of users who are watching the broadcast.
Viewers : The number of users who have seen at least part of the live broadcast.
Currently there is no built-in tool for live video analytics - you need to record manually or take screenshots.
Calculation of more complex indicators
Growth
Growth metrics help understand the change in the dynamics of a certain indicator. For example, you can see how the number of subscribers grows over time.
Value at time 1 - Value at time 2 / Value at time 1
Examples of indicators: growth of subscribers, growth of impressions, growth of engagement, growth in the number of clicks, growth of responses to stories.
Rates
Relative measures help evaluate an indicator relative to another. For example, engagement rate is the percentage of a profile's followers that interacted with a particular Instagram post.
Indicator / Number of subscribers at the time of publication of the entry
The common denominator for this formula is the number of subscribers. The result is a relative rate per subscriber.
Metric examples: impression rate, reach rate, view rate, click rate, exit rate, completion rate.
The View Rate helps you calculate the percentage of users who have viewed all of your Instagram Stories to the end. Calculated by dividing the number of views of the last story by the first.
Average
Averages provide a benchmark for assessing the overall performance of Instagram posts. For example, the average number of likes for a post helps to understand how subscribers like posts.
Sum of indicators for a period of time (for example, all likes for publications in January) / Number of publications for a period of time
The common denominator for these Instagram metrics is the number of posts in a given period. For example, you can calculate the average number of viewers for Instagram videos on different days of the week to determine which day is best for live streaming.
Examples: Average Comments, Average Reach, Average Reach for Stories, Average Live Viewers.
Top scores
These are not indicators per se, but they are still valuable for the marketer and analyst. Based on the best posts in terms of views, comments, likes, reach, engagement, you can understand which posts subscribers like and make new posts based on the data received.
Examples: best posts, best videos, most commented and liked posts.
Free analytics tools
Instagram Insights
Almost all the indicators we talked about above are shown by Instagram in its own analytics tool — Insights.
To access Instagram analytics, you need to upgrade your profile from regular to business if you haven't already done so. Then click on the button to the right of the settings icon. Important: Instagram Insights is only available on mobile apps.
At the top of the main statistics screen, indicators of reach, profile views, impressions, clicks to the site are displayed
Top Publications
In this section, Insights shows you the top six posts from the last week sorted by impressions. To see the statistics of all entries, click "View More".
Statistics can be filtered by three indicators: type of publications (all, photos, videos, "loop galleries"), type of metrics (impressions, reach, engagement, comments, views (for videos), time interval (week, 30 days, three months , six months, one year, two years)
Publication statistics can be viewed directly in the entry itself using the corresponding button.
Analytics Stories
The next block is Stories analytics. The main screen displays active Stories that have been posted in the last 24 hours. To view the analytics of all publications, you need to click "Details".
There, you can view story statistics by two filters: metric type (impressions, reach, exits, forward taps, back taps, and replies) and time interval (24 hours, 7 days, and 14 days).
Followers
This section shows what hours and days of the week your audience is most active on Instagram. Detailed statistics include the number of subscribers (and growth over the past week), distribution by gender and age, cities and countries.
Important: You must have at least 100 followers to see demographics
Promotions
Here you can see the statistics of advertising publications on Instagram. Since Instagram uses the Facebook advertising system, you can also evaluate the performance of your ads in Facebook Ads Manager.
10 Free Analytics Services
Keyhole
Keyhole is a paid service with a free preview of Instagram profile analytics or a hashtag.
Available metrics: number of posts per week, top posts by engagement, number of posts with the hashtag, number of accounts using the hashtag, distribution of accounts using the hashtag by number of followers and gender.
Socialbakers
Socialbakers is a social media analytics tool, including Instagram. Visually displays basic information about the profile. The main features are available for free.
Available metrics: three most likes posts, three most comments posts, most liked posts, ten most used hashtags, first post on Instagram, distribution of posts per month.
Squarelovin
Squarelovin is a platform for creating user-generated content on Instagram, it has a free social media profile analytics tool.
Available metrics: subscriber growth, latest posts, monthly analytics (likes, comments), engagement (displaying likes and comments as a graph), the best time to post posts.
Simply Measured
Simply Measured is offering a free Instagram profile report with less than 25k followers.
Available metrics: number of posts, engagement, average number of likes and comments per post, most active commentators, frequently used photo and video filters.
Union Metrics
Union Metrics is a platform for multi-channel social media analytics. You can analyze the main indicators of your Instagram profile for the last month for free.
Available metrics: number of posts, followers, best time to post, best posts, best hashtags, most active followers.
Websta
Websta is a functional Instagram analytics tool. There are standard features for such services, in addition, you can reply to comments on posts directly from Websta.
Available metrics : number of posts, number of likes, engagement, number of followers, best time to post, most popular posts.
INK361
INK361 is another Instagram statistics tool. The free plan has basic information about the audience, profile, and the function of responding to comments.
Available metrics: engagement, number of posts, number of likes, post history, hashtags used, most popular posts.
SocialRank
SocialRank is a follower analysis tool for Twitter and Instagram. This service is more focused on the statistics of subscribers, rather than publications or profiles.
Available metrics : subscriber activity, keywords in subscriber information, popular hashtags of subscribers.
Pixlee
Pixlee is a social media marketing platform that uses user-generated content from Facebook, Instagram and other platforms. Pixlee has a free Instagram Analytics app with basic metrics. It is more suitable for large companies and popular bloggers.
Available metrics: subscribers, number of posts with brand mention, best subscriber posts about the brand, engagement, number of posts.
Picture.io
Picture.io is another Instagram analytics tool. Unlike other services, Picture.io calculates its own profile "influence" score on the social network.
Available metrics: "influencer" score, most popular photos.
Paid services for analytics
Four main paid Instagram analytics services with great functionality:
How to act on Instagram analytics and statistics
Choose the best days and hours for publication
Given that the Instagram feed is now generated by a special algorithm, like Facebook, there is no one perfect posting time for everyone. The followers of each profile are active at different times, so you need to study when your audience is most active.
This can be done by two main metrics: "Subscribers - hours" and "Subscribers - days". The first will tell you what time of day to post, the second - on what day of the week.
Optimize content based on subscriber demographics
Using Instagram Insights, you can analyze your audience by gender and age, as well as determine what content they like in terms of reach, impressions, and engagement. See which posts are popular and try to spot patterns.
For example, your audience may actively comment on product photos, but most of all like landscapes and still lifes. Accordingly, you can post more landscapes and still lifes to draw attention to your profile.
By studying demographic metrics, you can optimize content for the majority of subscribers. If your design account is mainly followed by women aged 25–34, then one content is needed, and if men are 35–44, then another.
Make interesting posts in Stories
Using Stories analytics, you can make interesting posts there. See which stories get the best reach and most replies, and which ones get the highest number of exits.
You can use photo editors like Canva or Over to create interesting Stories. With their help, graphics and text can be added to photos.
Experiment with CTA
Only one link can be added to an Instagram profile information, so marketers usually place the targeted action there. Using click statistics in Instagram Insights, you can evaluate how effective your call to action is.
Also, use a link shortening service like Bitly or Goo.gl to get click data from there as well.
***
I also asked the experts to talk about how Instagram metrics help to run effective marketing campaigns on this social network.
Instagram is suitable for small companies, especially in the regions - the social network has managed to find itself even where VKontakte targeting does not work well.
To get noticed, just add “beautiful-photos-than-neighbor”, geotags and hashtags.
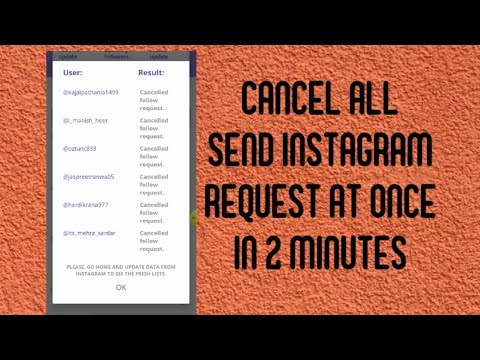
Most businesses decide not to waste time on trifles and attract more coverage — with the help of mass liking (ML) or mass following (MF) — usually a specially trained robot likes or subscribes to everyone according to the specified criteria. You all see ten of these profiles in the feed every day - flower studios, tanning salons, whatever.
"Mass-anything" certainly works as a technique - of course, more people will definitely see you, some people, maybe even buy something or sign up. But some will mark your profile as spam, which means that Instagram may well block your profile. To spam or not to be is up to you. Mass liking is tempting as hell because it quickly shows some results.
Organic growth is almost always slow and often picks up after six months to a year. That is, if you just post very good photos (which also need to be done, and this is time and money), it will take more time to build relationships between your company and people.
But these relationships will be stronger and cooler.
If you want results now, but decency doesn't allow spamming, Instagram has inexpensive advertising in Russia, especially in the regions. There will also be a link on advertising photos - that is, the CTR is higher than that of mass items.
By the way, links have recently appeared in Stories, and it works well. The coverage is about 10-15% of the audience, everyone seems to scale well even for large accounts. I don't know about CTR.
Nat Gadzhibalaev, General Director of the service of publication and analytics in social networks "Amplifer"
We have a fairly young account and only 500 subscribers. We are still at the testing stage and are looking at the Instagram audience: we are trying different ways of communication and watching how the audience reacts.
For analytics, we use Amplifr.com and Minter.io when we want to answer the question of what should be published in order to ensure audience growth.
We spend quite a bit on promotion and wait.
It's easier with advertising: Instagram is included in the retargeting funnel, and we "warm up" users to purchase the holding's products and services. The fact that Instagram works better than other channels for sales led us to the idea that we need to fully maintain an account on this social network.
Viktor Babichev, digital director of the Atlas holding
We take our work with Instagram seriously, therefore, in addition to the standard functionality of Amplifr, we use advanced mobile analytics tools — Adjust and Periscope. They show the most important metrics for us: the number of installations and trips of customers, cohorts. With them, we know exactly which promotion method has generated the most new, high-quality users.
Now on instagram we work in three directions:
- Bloggers. We evaluate the effectiveness of bloggers using an attribution promo code.
According to it, we see how many people installed the application and went after seeing the blogger's post.
- Instagram page. In addition to the standard estimates of reach, engagement and subscriber growth, we also look at the number of installs. To do this, use the tagged link in the page profile.
- Advertising. Everything is standard here: we mark the link on advertisements with Adjust and collect full post-click analytics.
Mikhail Starov, Marketing Director, Wheely
For us, Instagram is the main channel for working with users. There we tell who we are and what we do. We use only organic and honest advertising methods so as not to spoil the statistics. It is important for us to see a loyal audience that is interested in our products.
The first thing we look at is likes and comments. We record the number of likes and comments for each post, indicating its subject. The second is posting time.
We found a good timing for releasing records. Based on likes and comments, the following publications are created, since you can even track which color scheme and plot in the photo people like best.
People can subscribe to us simply as to a beautiful account, and then people delve into the fact that we print photo books, and already become our clients.
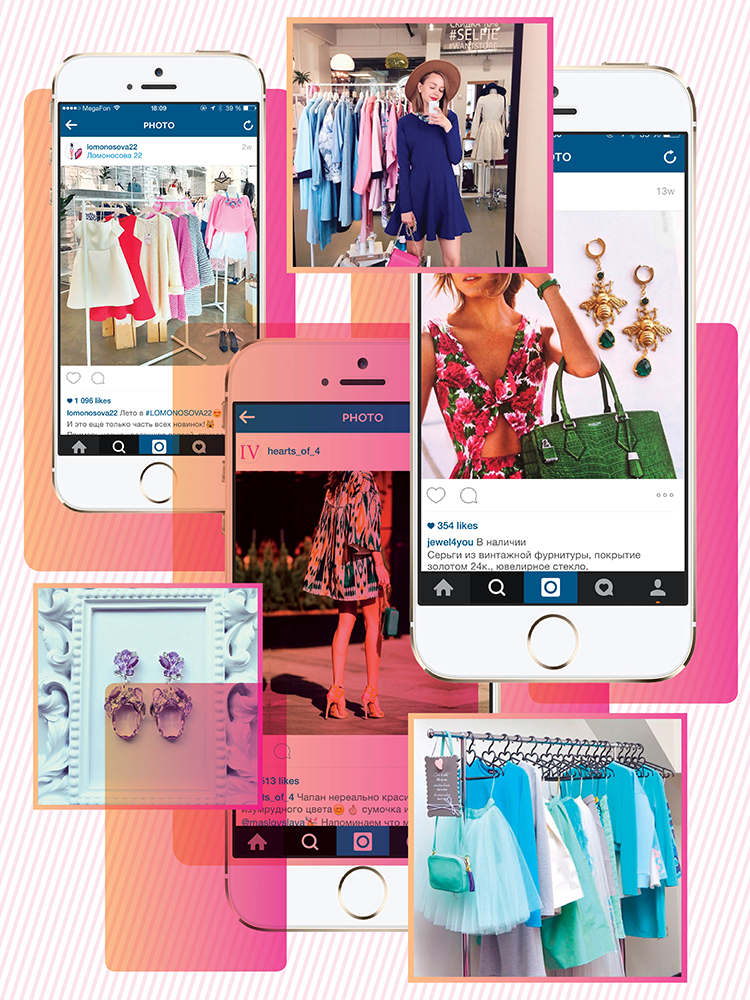
We select photos that match the overall style of our account, they blend well with each other. The text under the photo should be short and informative. We are supporters of not just beautiful, but interesting and informative content. Thanks to comment tracking, we learned what topics our subscribers are interested in, and came up with rubrics, each of which is assigned a hashtag.
It's easy to get lost on Instagram, so we came up with a hashtag navigation system. And new users can see all the publications of a particular category and find answers to their questions.
We make photobooks from photographs, mostly taken with a phone.
Wherever a user spends time, if he is fond of mobile photography, he is on Instagram. For analytics, we work with Planoly, mainly because of the convenient content scheduling options. It allows you to arrange photos and publish from your phone.
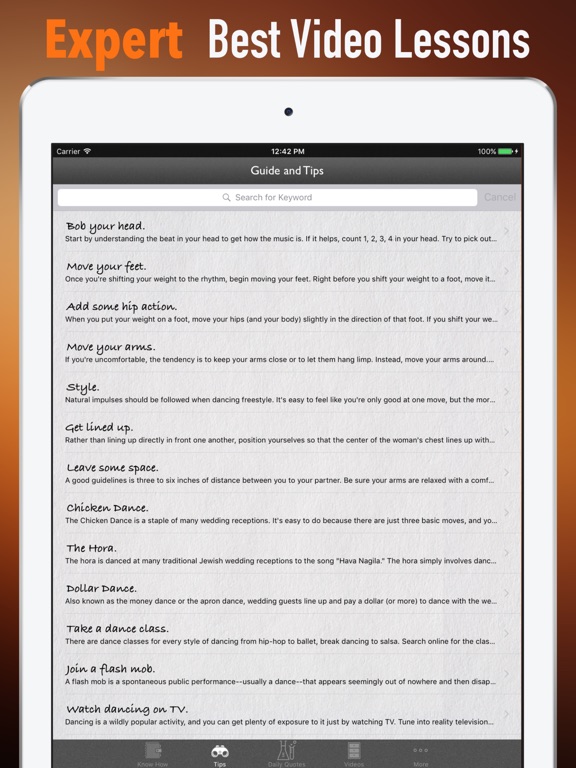
First of all, I advise you to remember that Instagram is a visual platform. Beautiful photographs and clear captions. People read Instagram for distraction, so the focus of the content should be inspiring and entertaining.
You need to find your own way to talk about a product or service using the Instagram language.
I like that on Instagram most of the photos are taken on the phone. If I want to buy something, I always look at what it looks like in "real life", shot by ordinary users, and not on edited promo pictures.
Tracking metrics with a small account is easy, you need discipline: create a table in Google Doc with a publication schedule, where you fix the topic of the post, likes and comments on it - this is free and useful analytics, besides, it is really useful.
Also watch for correlations and experiment. Collaborate with brands, bloggers and influencers who may be of interest to your audience.
Varvara Vedeneeva, co-founder and CEO of the Periodica Press service
Share!
ER ( Engagement Rate, English - engagement level ) is a metric that reflects the level of audience engagement with your posts. The higher the ER score, the more interesting your posts are to your followers and they express this in the form of likes and comments. Simply put, if you have 20,000 subscribers and posts get 20-30 likes, this is not good.
In this article, we will talk about which ER calculation formula to use, tell you what the engagement rate affects and share recommendations for improving it.
Program for promotion in Instagram - SocialKit:
Registration >>>
See also: How to increase the coverage of posts on Instagram
For different social networks, ER can and should be calculated in different ways. Yes, and on Instagram there are many formulas for calculating ER. Therefore, it is incorrect to compare the ER indicators of different services, since they can use different algorithms.
Let's describe some basic approaches to calculating ER.
One of the most popular approaches is the calculation of ER per post. Or the average engagement rate per post. The formula looks like this:
ER = (likes + comments) / subscribers * 100%.
For example, you have 1000 followers and your last post got 90 likes and 10 comments. It turns out, ER = (90 + 10) / 1000 * 100% = 10%. Accordingly, to calculate the ER of the entire account, you need to add the ER for each post and divide by the total number of posts. Most often, not all posts are taken into account, but the last 10-20 or all posts for the last month.
The data is visible under each post for those who switched to business profile .
Another formula that is popular when calculating ER, instead of the number of subscribers, the reach that the post received is taken into account.
ER = (likes + comments) / reach per post * 100%.
This calculation method can be considered more accurate, since not all subscribers see new publications, and the coverage reflects just those who have seen. For example, with all the same indicators as in the previous example, we will not divide by 1000 subscribers, but by coverage, let's say it was 400. It turns out that ER = (90 + 10) / 400 * 100% = 25%. Even for 1000 subscribers, this is a very high figure. With further growth of the account, the indicator will decrease and this is normal.
Both values should be counted. The first speaks about the quality of the subscription base in general, the second about the activity of the audience that sees the posts.
The more subscribers, the lower the ER, and this is basically a normal phenomenon. All this is happening due to the fact that Instagram purposefully pessimizes posts so that users are motivated to launch ads on Instagram . It is possible that profiles that are transferred to a business account, which indicates a clear commercial component, receive even more pessimization (but this is not certain).
But here one more factor must be taken into account - the level of reach of the audience. It can be conditionally divided into 4 groups:
It turns out that the more users you have in your subscribers with a small number of outgoing subscriptions, the better your audience is and the more often it will see your posts. Related article: Gathering the target audience on Instagram .
Based on this, accounts with different subscription bases will have different ER indicators (calculated according to the second principle). For example, for an account from 5,000 to 10,000 subscribers, the normal figure is 10-20%, for accounts with more than 10,000 subscribers, this figure usually drops to around 5%, everything over 100,000 is 3%, and million accounts up to 1%.
Again, these indicators should not be considered as the ultimate truth. Instagram is changing very rapidly, so the algorithms are changing, and each account is a separate case that needs to be considered individually.
To act in this direction is to improve the quality of content and the quality of the audience. But again, there is no single algorithm by which you can increase ER, each situation is individual in its own way. Here is a list of the main recommendations:
 Check what your ER indicator is now, whether you or the agency that leads you are doing cheat likes on posts, how many bots you have in subscribers, how often you publish new content.