If you are merely a casual user of Instagram, showing a few pictures with your friends, you may not see any need to track your Instagram followers, or indeed how your posts perform. However, if you take your Instagramming more seriously, you are going to want to keep a vigilant eye on your Instagram account, along with the genuineness of your followers.
This is particularly the case for influencers and brands. In both cases, the quality of their following matters very much. Ultimately brands are only in the social space to strike a dialogue with their customers and potential clients. Their work with influencers has the same overall goal. There is little point in having followers who are not part of their target market.
It is perhaps less crucial for non-commercially minded influencers. However, they, too, are unlikely to be influential with people who couldn't care less about their posts.
Brands and influencers are also interested in the behavior of their followers. What types of posts interest them? Which topics are of little importance and get ignored? As far as serious influencers are concerned, analytics, and data about their Instagram performance can be a godsend, and help them make more interesting and valued posts.
The following list highlights tools that, in some way, help you track your Instagram followers, and in many cases, the overall performance of your Instagram account.
We begin this list by giving a plug for our own free Fake Follower & Audience Credibility Checker, which is powered by HypeAuditor.
The first requirement of being an influencer, obviously, is that you can influence the decisions and views of others in your specialist niche. People see what you write, say, or show, and take notice of your opinions. They respect you, so they believe that your advice and views are accurate.
This is why fake followers are of no value for any serious social media activity. Fake followers will never take your advice. They will never buy your products or engage you for services. They send misleading messages and suggest levels of reach that simply don’t exist.
On paper, fake followers may make influencers look more prominent. In reality, people can easily see through fake followers, and having too many of them can cast doubts on the credibility of an influencer.
Our Fake Follower & Audience Credibility Checker can remove your worry about the authenticity of an influencer’s account. You can enter any influencer’s Instagram handle into the tool, and it will give you an excellent guide to the genuineness of the account.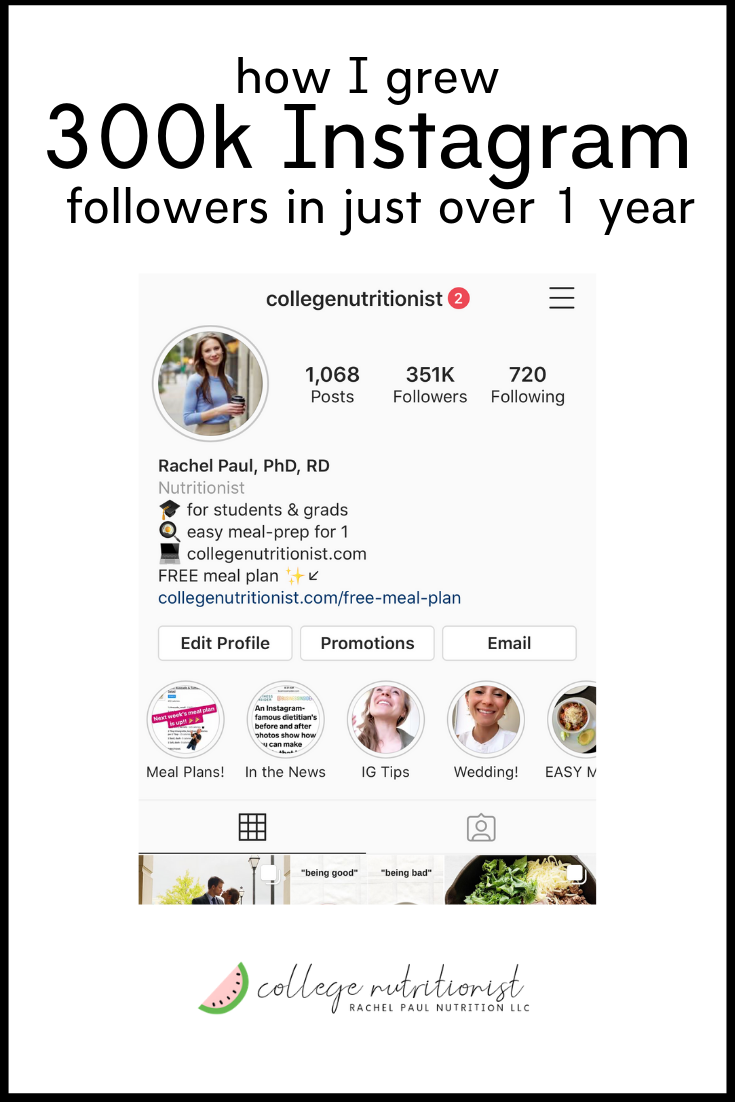
You can also use our Fake Follower & Audience Credibility Checker to do an Instagram Audit of your account, so you can determine whether you have to take action to remove the trash from your followers.
Iconsquare offers both free and paid tools that help you track your Instagram followers. Their free tool provides an Instant Instagram Audit. All you have to do is to connect your Instagram account and enter your email address. They will then send you a free report that tells you where you’re shining and where you’re falling flat. Instagram Audit analyzes 20+ metrics on your latest 30 posts over the last 30 days. It provides tips on your account activity, audience engagement, account settings, and content strategy.
The paid version of Iconsquare offers a robust analytics, management, and scheduling platform for brands and agencies. A customized dashboard quickly visualizes the metrics most important to you, and scheduled reports help you stay on top of your game. Graphs display your performance for metrics like follower evolution, average engagement rate per post, and reach and impressions history. Benchmarks for over 100 industries allow you to compare your performance using metrics like follower growth, engagement, and reach. It includes community analytics, so you can understand where your followers are, the languages they speak, and their age and gender.
A recent addition allows you to understand how your Instagram promoted posts impacted your performance across metrics like reach, engagement, impressions, follower growth, and more.
4.4 out of 5 stars
Manage your social media and your analytics all in one place with Iconosquare. Businesses and agencies can easily manage the performance of their content as well as analytics, posting, and more. The platform supports Instagram, Facebook, Twitter, LinkedIn and TikTok.
Ratings
Overall Score
4.4
Features & Pricing
Analytics
Automated Publishing
Contact Management
Keyword Filtering
Multi-Account Management
Post Scheduling
Social Media Management
Price starting at:$49
Pros and Cons
Evolving functionality
Industry benchmarks
Competitive analysis features
Excellent automated posts
Customer support may not be helpful
Some features may glitch
Some platforms are not included
Best for: Brands and Agencies
4. 4 out of 5 stars
Manage your social media and your analytics all in one place with Iconosquare. Businesses and agencies can easily manage the performance of their content as well as analytics, posting, and more. The platform supports Instagram, Facebook, Twitter, LinkedIn and TikTok.
View
If you have a business Instagram account, you will have free access to Instagram Insights. It is Instagram’s native analytics tool that provides data on follower demographics and actions, along with your content. You can use it to access data for your account as a whole, each post, and your Stories.
Instagram Insights’ home page gives you a summary of data for the content you’ve posted in the last week. In the top section, you will find the total number of followers you have and how many you’ve gained in the past seven days.
If you scroll further down the home page, you will find a Followers section. This gives you a summary of follower demographics, including gender, age group, and location. If you tap See More, Insights will show you graphs breaking down follower demographics in more detail. You can segment your follower data by:
You can also find some follower-related information if you click on the View Insights button on an individual post. One particularly interesting stat is the number of people who begin following you as a result of a post.
By the way, if you are paying for Instagram Ads, you have another option for your analytics. You can view metrics relating to your Instagram ad in Ads Manager. While this won’t tell you much about your followers as such, it does tell you about your ads Performance, Demographics, and Placement. The results that Ads Manager shows depend on the objective you set for your campaign.
Social Bakers is primarily a social media management platform that you can use to manage all your marketing tasks together easier.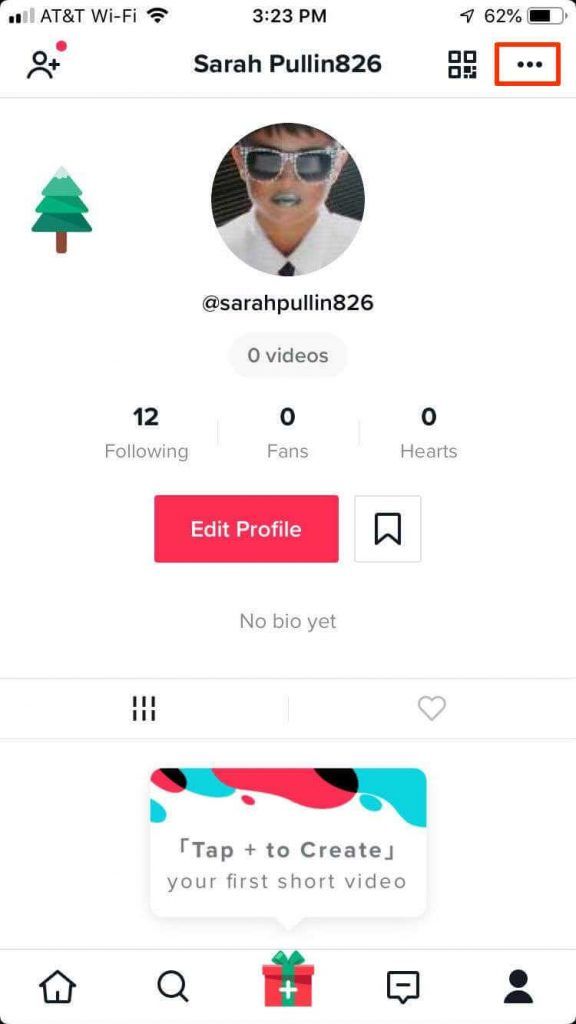 It includes an Analytics & Benchmark section that covers everything from benchmarking, content, and performance to influencers and paid campaigns. You can use it to get the full information you need to understand your performance. It allows you to benchmark your organic, paid, video, and influencer performance metrics against industry averages or competitors.
Although not as advanced as the paid tool, Socialbakers offers a free Instagram Analytics Tool for personal and business profiles. It allows you to discover your most popular Instagram posts, track your success, and learn what gets your audience double-tapping. It shows your most popular photos, filters, and hashtags, although it only offers limited information about your followers.
Union Metrics offers a free Instagram account checkup. It is of limited use to understanding your followers over time, although it provides some insights into how your account is performing currently.
The Union Metrics paid plans provide more information to marketers. The $49/mo Social Manager plan allows you to analyze engagement and measure the performance of your social accounts. With the $99/mo Social Marketer plan, you can monitor relevant conversations and generate audience insights with in-depth reporting. At the top end, you have the $199/mo Marketing Team package that offers all the analysis, monitoring, and reporting you need for comprehensive social marketing.
You can use Union Metrics to monitor all your social profiles to learn precisely how your content performs. It will show you what content works across social media – and what doesn’t, and when your audience is most receptive to find the best time to post.
Social Blade provides a wealth of stats on public Instagram media accounts. They pull data explicitly from your public profile, so you won’t find anything if you have made your account Private – but if you are a business or influencer, it makes no sense to have a Private account.
For future projections, you do need to provide them with at least two points, so you need to scan your account multiple times over time if you want to build a set of useful data.
Social Blade also shows quite a few interesting charts about the top Instagram accounts, such as the Top 50 (and 100) Followed Instagram Users. They do emphasize that they are using the new Instagram API, so they can only get data on Instagram business/creator accounts.
https://socialrank.com/assets/video/tut1.mp4
You can use SocialRank to discover detailed audience metrics for Instagram, as well as Twitter. You can segment your audience by using various sorting and filtering options. You can create custom lists, export the data to PDF, and run campaigns.
You can sort your audience by Most Valuable (your most influential profiles), Most Engaged (determined by the frequency of engagement), Best Followers (a combination of Most Valuable and Most Engaged), Most Followed, Alphabetized and Chronological (Newest and Oldest). You can also filter and pinpoint your audience by filters ranging from bio keyword, word/hashtag search, and geographic location, to verified number of followers, activity, and more.
Squarelovin offers a free in-depth analytics tool that gives you access to metrics on your recent posts and growth, a monthly analysis, and a history of your posts broken down into year, month, day, and hour. It provides you with more insights on your communities’ preferences and interests, and what drives engagement. Squarelovin even shows you your best and worst times to post.
Owlmetrics provides real-time actionable analytics for your Instagram account. It tracks all the critical data from your Instagram account and presents it in an easy-to-read dashboard.
It goes into considerable detail in places, including information like your most engaging photo and video filters and top tags by interactions. You can use it to establish the best time to post for your followers.
Owlmetrics provides you with daily data regarding your post engagement rates, top posts by engagement rate, and the best-performing types of posts.
It shows you where your followers spend the most time through click rates. It shows you your total clicks, average clicks per post, and your clicks change rate. It even drills down to clicks by language, clicks by browser, clicks that are referred from another source, and clicks by location.
Owlmetrics shows you your total followers and the growth of total followers, as well as the followers you’ve gained and lost. It lists your top gained followers and top lost followers.
One of the more useful features of Owlmetrics is its competitor tracking, giving you a detailed overview of the Instagram insights for competitors, which it updates in real-time.
If you don’t like Instagram likes anymore or you’ve never liked it much from the...
Social MediaWe’re all familiar with the frequency at which Instagram introduces new features and...
Creator Economy • Social MediaDecentralized finance (DeFi) is still a relatively new financial technology, but this...
The concept of verified profiles on Instagram was a huge success when it was initially launched. In the beginning, fans were happy to be able to find the real profile of their favorite celebrities. Many users even found out that they were following a fake account all this time.
However, after some time, the craze died down for the users, at least for a little while. When Gen Z started using the platform, the craze was back again, but this time for a different reason. Instagram rolled out a feature called “Request Verification,” using which you can ask the platform to give you a badge after looking at your profile and engagement.
So, the verified badges aren’t quite the big deal now as they were back then. Almost all famous YouTube content creators or brand influencers have verified accounts. Moreover, the requirements for the badge have also gone down. You only need at least 10,000 followers on Instagram for a verified profile. Isn’t that crazy?
In today’s blog, we’ll talk about the most asked question, “Which of my followers has the most followers on Instagram?” and “How to see your most followed follower on Instagram”.
Can You See Your Most Followed Follower on Instagram?
How to See Most Followed Followers on Instagram
1. Going Through Your Followers List Manually
2. Instagram Insights
3. SocialRank – Who is My Most Followed Follower
4. Owlmetrics – Which of My Followers Has The Most Followers
Yes, you can see your most followed follower on Instagram. However, whether or not it’s plausible for you is a different thing altogether as Instagram doesn’t have any feature that tells you who your most followed follower is. You’ll just have to find that out on your own.
The biggest factor here is the number of followers your Instagram profile has. If you have a private account with about 150-300 followers, then you might be able to find out which of my followers has the most followers.
On the other hand, if you’re an influencer/personal brand/small business owner, then it’s not possible for you to seek out your most followed follower in the same way. But that doesn’t mean that you can’t do it at all. Analyzing your followers and following is an important part of your social media strategy.
However, we’ll first talk about how a user with a non-verified account can find out their most followed follower.
If you have a verified account, then we understand that it can be problematic for you to follow this method. Don’t worry; in the upcoming sections, we’re going to discuss other ways to find out your most followed follower.
The first tool that we’re going to talk about is Instagram Insights. If you’re a social media influencer or have a verified profile, then you must’ve already heard about it.
We assume this because every business account on Instagram has free access to Instagram Insights. This is a very helpful and efficient analytics tool that helps you with your social media engagement, analytics, and management.
It’ll provide you with detailed demographics of your followers’ activity on your account. You can also request specific data, like all the engagement on a single post, story, or highlight.
Moreover, it also helps you attract your target audience, along with categorizing your current audience (followers). Below are some of the above-mentioned categories:
You will find more follower-related insight if you click on the View Insight button on a single post. Besides the basic information, it’ll also tell you how many followers you gained as a result of that post. Isn’t that amazing?
If you’re willing to pay for Instagram ads, you’ll also be able to see the metrics related to your ads in the Ads manager. Although this feature won’t give you much information about your followers, it will give you an insight into the ad placements and the engagement on your profile due to the ad. And it goes without saying, you’ll be able to reach your target audience much more quickly.
SocialRank is a third-party analytical tool that helps user analyze and arrange their followers with the help of keywords and filters. However, they have a fun way of doing so.
Following are some of the ways you can sort through your followers (in reverse chronological order):
Moreover, you can also sort your followers by the keywords that they use the most in their stories and captions and their location.
A great example of this app’s functioning is stated by SocialRank’s founder Alexander Taub.
Taub has a Havanese pup named Bart as a pet. He says, “There is no place I could go right now and find 100 people- that follow me on Instagram, that live in NYC, and use the hashtag #dog- that I can connect with. ”
”
This is precisely what you can achieve with this app. You can find the location of your followers and see the hashtags that they use. Then, you can use that information to reorganize your established networks on social media.
Let us suppose that you’re a music director who’s looking for a singer on an urgent basis for a song idea you came up with. All you’ll need to do is sort your followers on the basis of location first and hashtag (let us say #singer) second. You’d have the names of all the people who are currently in your city and consider themselves as singers.
All of this is just under a few minutes! Isn’t that amazing?
The last analytical tool that we will be talking about today is called Owlmetrics. This is a real-time actionable analytics tool that helps you track your audience engagement through clicks and then present it to you in an easy-to-read dashboard. Doesn’t that sound easy? Let us see how it really works.
It goes into incredible detail in a few aspects. For instance, it’ll calculate your most engaging photo and video filters and the most interacted hashtags. You can also find out the best time for you to post in order to get maximum engagement from your followers.
It’ll tell you the total number of clicks on your profile, clicks per post, and the clicks change rate. Moreover, it’ll also show you the clicks by languages, clicks through other sources, clicks through browsers, and clicks through different locations.
Lastly, you can see all top gained and lost followers with the calculated gain and loss percent.
Also Read:
Instagram account analytics service - LiveDune provides in-depth statistics of your profiles
Try for free02
Graphs help to understand how quickly followers are gained in the account: how many people were there a week ago, a month. And the “Subscribed / unsubscribed” graph helps to understand how much the audience has updated over a certain period. Usually, if there was a lot of influx of a new audience, it makes sense to adapt the content for beginners.
03
In the LiveDune Instagram account analysis service, you can build top or anti-top posts using filters, sorting and combinations of indicators. Analyze content by ratings, categories, post type, likes, comments, saves, views, reach, engagement metrics (RR, ER, ERR), etc. This will help you understand what content to post and answer the question “How to increase statistics on Instagram?”.
Try for free04
Check Instagram engagement using LiveDune can be assessed using two metrics: ER and ERR. The higher the engagement rate, the more active audience you have. We will not only calculate the engagement for you, but compare it with other accounts by the number of followers and in the same category.
05
Detailed statistics of Instagram account subscribers with the ability to track changes over the analyzed period. For example, to see from which cities you have been subscribed more over the past month. Data can be viewed visually in graphs or uploaded to Excel.
Try for free06
It makes no sense to focus on generally accepted peaks (9:00, 12:30, 17:00, 21:00) when publishing posts, as it was with the chronological feed. But focusing on the time at which the largest number of account subscribers is active is the most correct. In the table, we will show when your followers are online and recommend hours for posting.
Try for free07
You can see the TOP hashtags, using which the posts got the most reactions (likes, comments, saves). Or find out which hashtags your competitors use the most so you don't have to manually collect data. Hashtags are collected both from the text of the post and from the comments under the post.
08
On average, compiling an SMM report takes 8 hours. In the LiveDune Instagram statistics tracking service, you can set up a weekly and monthly report in several formats (PDF, email, Excel, Google Slides) in 5 minutes. Spend the saved time searching for hypotheses and insights to work out in the next period.
Download example PDF report
Download sample Excel report
Capabilities
Analyze the effectiveness of your content strategy and monitor your competitors.
Hourly collection of statistics on your accounts or competitors' accounts for detailed analysis and search for growth points.
More
New
Operators, tags, notes, dialog statuses, statistics and other functions will help you optimize your work with Direct.
More
Monitoring and processing of new comments, messages and mentions from social networks in one window, analysis of sentiment and response speed of managers.
Details
New
Regular express audit of your Instagram account with clear conclusions and tips for promoting your account.
More
Export reports to PDF, Google Slides and Excel . We will also send weekly and monthly reports to your email.
More
Set KPIs for each account and track their progress in real time. You no longer need to calculate anything in Excel.
Details
Schedule posts to all your accounts a month in advance in 5 minutes in one place. And we will publish the content, collect new comments and statistics on them.
More
It will help to select bloggers without markups and with good activity so as not to drain the budget.
More
FAQ
Post statistics, like other statistics, is available only on professional accounts: Business account or Author account. Read more about how to switch to a professional account in the article.
Reach is the number of people who have seen certain information in your account. It can be a post, stories, the blog itself or an advertisement. It only takes into account unique visitors, so repeated actions by the same person will not be counted. For example, if one person saw your post three times, that would count as 1 reach and 3 impressions. Impressions are always greater than reach.
After registration, add someone else's account to the Dashboard and view the statistics. On other people's accounts, statistics of posts, engagement and growth of subscribers will be available. Instagram profile analysis is available only for a Business account or an Author account.
To view Instagram account statistics online, register in LiveDune and add the account to the Dashboard. The first 7 days are free. Statistics are available only on professional accounts: Business account or Author account.
Engagement is the percentage of active audience from the total number of subscribers. You can get acquainted with all types of engagement indicators and the formulas by which they are calculated in the article.
Sign up and add an Instagram account to the Dashboard. Next, open the Stories tab.
Only available for own accounts.
Sign up and add an Instagram account to the Dashboard. Next, open the Posts tab. At the end, you will find 3 graphs to analyze the performance of hashtags. Hashtag statistics analysis is only available for new posts.
Your accounts are safe because we work with social networks officially and do not ask for passwords.
There is a description for each graph and each figure - you can easily understand what this or that metric means.
Invite and set up access for colleagues to work on improving your accounts together.
Do you have your own internal systems? Great, you can pull data from us, from one place.
Reviews
This is my main social media reporting and analytics tool. I sincerely cannot imagine my life without a dashboard and uploads from Instagram profiles. Based on the data from the downloads, audits are built, work is underway on strategies and project supervision. In my opinion, today Livedune is the most effective tool for analytics of your own pages in social networks and a must-have tool for anyone involved in SMM.
Alexey Tkachuk
SMM strategist and blog creator Dnative. ru
ru
We use LiveDune to track our account statistics on a regular basis and to prepare reports. And based on the data received, we adjust the overall promotion strategy. We use the Dashboard as actively as possible (it’s convenient that there are post ratings and a section with data on advertising on Instagram has appeared) and the Comparison module. In general, we love LiveDune very much and are happy to test new features :)
Andrey Komissarov
Head of Communications Authentica and Shamelessly Talented
We have been working with LiveDune for two years now. All this time, the service is constantly evolving: managers respond to our requests and add new features that we need. We follow a couple of hundred accounts of our teams and divisions, players, so a qualitative comparison is required in various parameters. All of this is there and works great. It is also very convenient to keep track of all the KPIs of your VK and Instagram accounts: reach, engagement, views, popular posts. There are flexible reports with tables and presentations for management. The dashboard interface is the most convenient and understandable, it is a pleasure to work with it!
Artyom Sadovnikov
Head of the PR department of the Student Basketball Association
Livedune is love. Love, numbers and endless benefits. I have been working with the service since 2015 and connect absolutely to every project. First of all, I use it to analyze communities, pages and content. SMM is getting deeper every year, and you need to somehow understand all this. Reports, statistics, analytics - I go to Livedune for everything. Personal thanks to the developers for the Telegram bot for comments and project KPI management.
Stanislav Son
SMM HEAD FINNTRAIL Russia
How did followers come across your account? What posts do they most often save, which ones do they forward to friends, after which ones do they most often decide to call or write? What cities do they live in? How old are they? What days of the week and what time of day are they most active on Instagram?
Statistics Instagram allows you to find out this most valuable information and, thanks to it, work more accurately with your audience and increase sales.
To access statistics, you need to switch your account to a business profile. Click on the menu (horizontal stripes) in the upper right corner, select from the list "Settings" , then "Account" and "Switch to a professional account" .
More on this: "How to create a business account on Instagram."
Statistics will be collected from the moment you switched.
Now under each post we have a sentence "View statistics" . By clicking on it, we see several numbers.
We had information about the number of likes and comments before. But now we also have "airplane" - the number below it shows how many times your publication was sent to direct to other people. And also "flag" - it signals how many times your post has been saved.
"Profile visits - 9» . What do these words and numbers mean? The fact that 9 people who viewed the publication wanted to go to your profile.
Is it good or bad?
It may be different. This could mean that your subscriber thought:
“Wow, what a great post. I really wanted to buy from them. I’ll go see what kind of company this is, maybe I’ll ask them a couple of questions about the product.”
Or vice versa:
“Who wrote such nonsense? When did I manage to subscribe to this? What for? I’ll go look at their profile, maybe I’ll remember why I signed up, if this is not something promising in the future, I’ll unsubscribe as soon as possible.
It shows how many people actually saw your post. For some, this figure may be shocking. Did you think that you have 10 thousand subscribers, and statistics show that each of your posts is seen by no more than 1 thousand people? Yes, it happens, and very often. Coverage from 30% to 60% is a good indicator for commercial accounts, 10% -15% is very common.
By "swiping up" (i.e. tapping the stats with your finger and dragging it up the screen), we see more stats.
"Subscriptions - 2". This entry indicates that two people who saw your post decided to follow your account. That is, they were not subscribers before. How do you know how they came across your post? The answer may be further.
Coverage - 1026 . The post was seen by 1026 people, we have already talked about this. Curiously, more than half of these people (52%) were not our subscribers. How did they see our post? We will also look for the answer to this question in the following data.
Impressions - 1597 . This entry means that the post was shown 1597 times. And Reach showed that our post was seen by 1,021 people – a lot less. How can this be? Very simple. The number of impressions is almost always greater than the reach, which means that part of the subscribers saw your post two or more times.
"From the Main - 770" . That is, 770 people saw your post just in their feed. These are your followers.
"From hashtags - 582" . 582 people came across this post thanks to hashtags. Here is a possible answer to the question of how 52% of people who were not our subscribers found our post, and where these two new subscribers came from. All of them came to you by hashtag, and two of them became interested in the account and stayed. Unfortunately, this cannot be said for sure, we can only guess by comparing the data on hashtags, subscriptions and the number of people reached who were not subscribed to you before.
"From profile - 7" . These seven first came to the main page of your account, and from there they already went to the post. In what cases does this happen? For example, another Instagram account linked to you, people came to your main page, and from there they went to the post.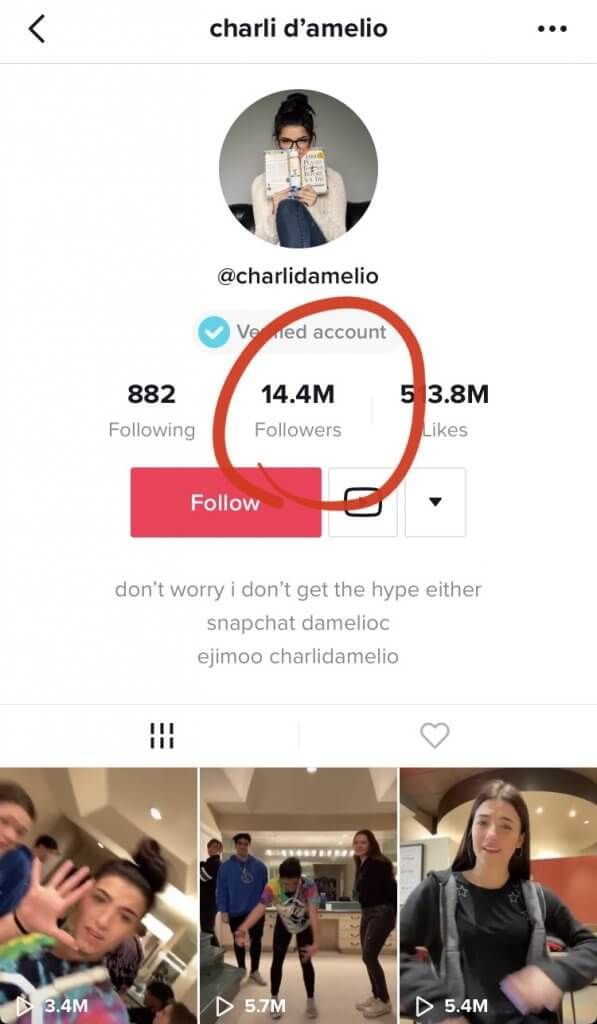 Either the link to Instagram was on your website, or customers saw the name of your account in the office. There may be many options. The main thing is that people first went to the profile, and then they came to this particular publication.
"From Another - 240" . This line tells you the number of people who came to your post from other sources. For example, someone sent them a link to this post in Direct or shared it in another way (in an email, via messengers, on a website), or your post was saved, and then they looked at it again, and this re-view was counted in the line " From the Other."
This way we can see the statistics of any post that was published after switching to a business profile.
We also have the opportunity to find out the statistics of the account as a whole.
To see the account statistics, we again need to go to the menu (horizontal bars in the upper right corner) and click on the line "Statistics" .
Here we see tabs "Content" , "Actions" and "Audience" .
In this tab, by default, we are shown our posts and stories sorted by reach. First, the most popular - that is, those who received the largest coverage, and then in descending order.
We are also told how many posts and stories we had in total in the last week (45) and how this compares to the previous week (5 more).
We can sort both posts and stories by different parameters and for different periods. By clicking on the button " All ", we get the opportunity to select posts with the most likes - to do this, select the line with the word "Like marks" . Or the one with the most comments. Or separate those posts, after viewing which readers started calling you - for this you need to select "Calls" . Or the ones that reposted the most.
You can also see the most successful posts by the sum of all these indicators - likes, comments, calls.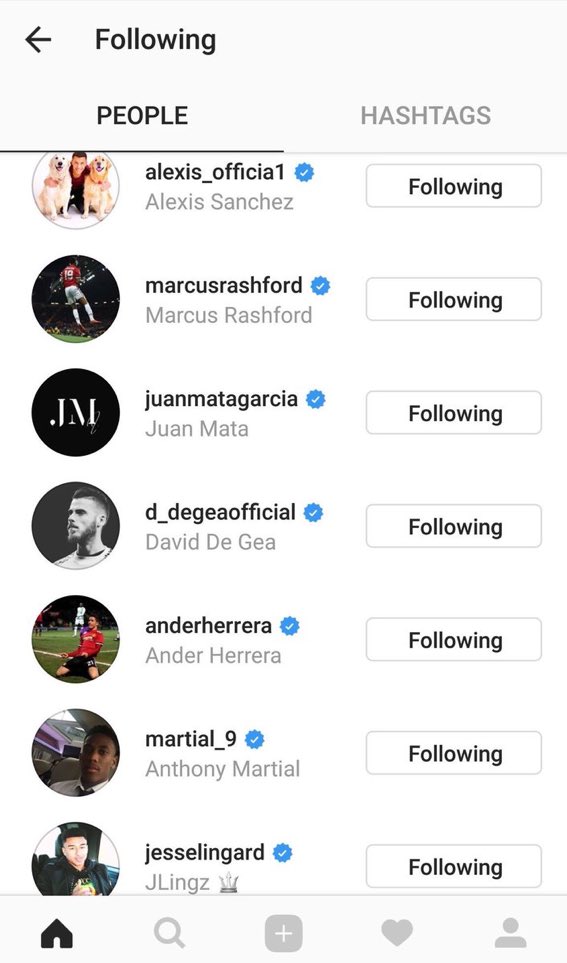 To do this, select the first line - "Engagement" .
We can also make a selection for different periods - a maximum of 2 years, a minimum of 7 days. And see separately the comparative indicators of photo posts, video posts, carousels.
The same with stories. We can sort them by ostentatious indicators - "reach", "clicks to the site", "calls" and others, and also make a selection for different periods, but the maximum possible period in the case of stories is 14 days.
In this tab, you can see how reach, impressions, and other important indicators have varied over the past week - the number of visits to the profile, clicks on the site, clicks on the "Getting Directed" button.
Explore shows our total reach and impressions for the last week.
We see that the coverage was 3854 people, and it is very much reduced compared to the previous week.
Total impressions - 17698 people, and also a noticeable decrease compared to the previous period.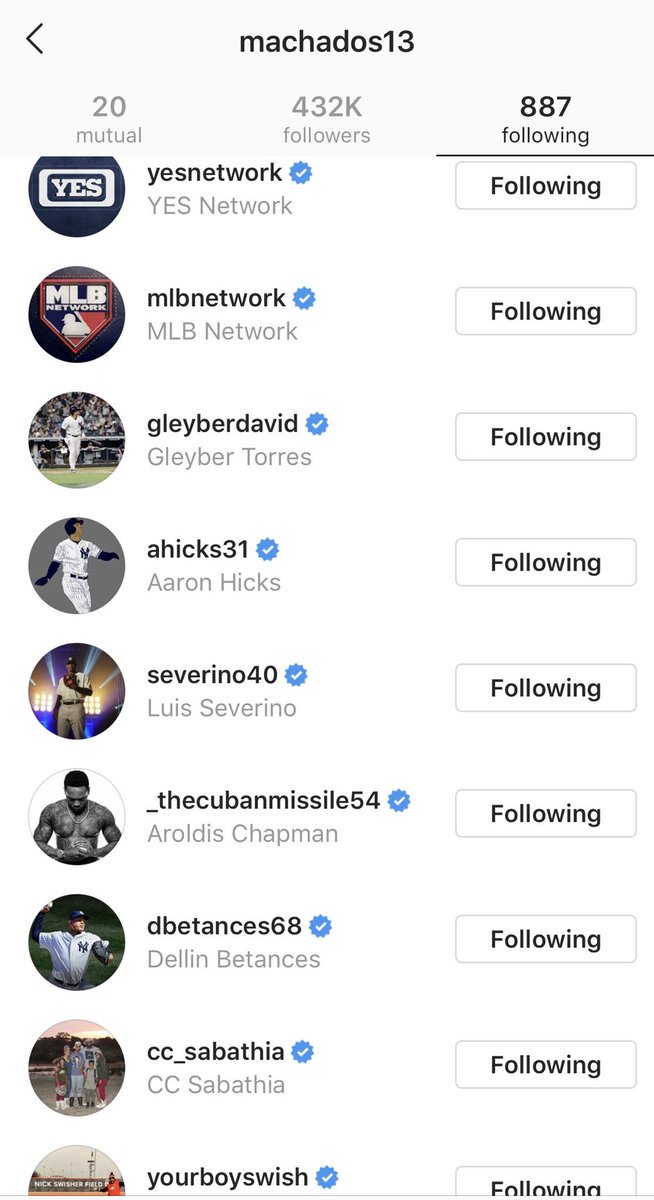
Also on the graph, we can see which days the coverage was more or less.
And by pointing a finger at this graph, we see specific figures - one and a half thousand coverage on Monday and Wednesday, almost the same on Tuesday, on other days much less.
In the "Interaction" block, you can see how many visits to the profile, clicks on the site from the profile, clicks on the button "How to get there".
We are also shown a graph of the distribution of this activity during the week. We see that the most actions were on Wednesday - 57 pieces.
To see specific figures, touch this graph with your finger.
In this tab, we can see how the number of your subscribers has changed over the past week, in which cities and countries your subscribers live, how old they are, what time they are most active.
This tab gives us information about the number of subscribers. In particular, about how many people have unsubscribed from us, how many have subscribed, and what the result is an increase - it can be positive and negative, when after all the subscriptions-unsubscribes, the number of subscribers has decreased.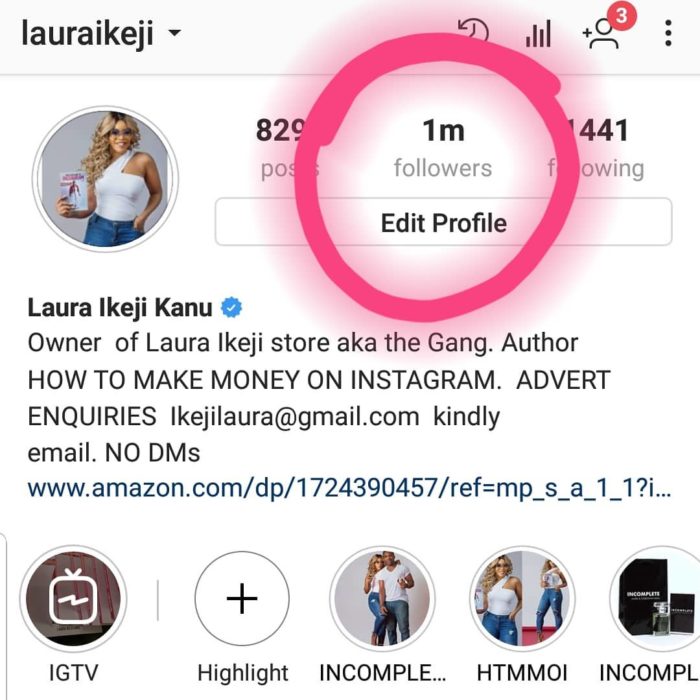
In our example, 12 unsubscribed, 16 subscribed, the final result is plus 4 subscribers this week.
Just below we see a graph of the number of subscribers. We see a failure on Saturday. We can press our finger on this failure, and we will be shown more detailed information about it. We see that on Saturday, December 7, three people unsubscribed from us and no one signed up.
And if we want to find out what kind of publications led to such a result, we can click on the button "View publications" and we will see just posts and stories for December 7-8 and statistics on them. In this way, you can understand which publications readers do not like. Although in our case the numbers are too small to speak of conclusions. Rather, they are within the bounds of statistical error.
Below we can see information about the cities in which our subscribers live.
As expected, the Moscow children's center, whose account we are considering, has the majority of subscribers from Moscow.
And by clicking on the button "Countries" , we will find out from which countries in what proportion we have subscribers. Also, most are expected from Russia, but there are also from Kazakhstan, the USA, Ukraine and even Brazil.
In the next section, we can see what age men and women are in our account.
We see that our subscribers are dominated by people aged 25 to 34 years, slightly less women and older men - from 35 to 44 years old.
Interestingly, our account is also followed by schoolchildren under the age of 17 and older people over 65. Where Instagram has gone!
Here we are shown that 71% of our subscribers are women, only 29% are men.
This section is called “Followers” for some reason, although it would be more correct to call it “Followers Activity”, because that is what it shows: at what time of the day and what days of the week your followers are most active on Instagram.