Instagram Stories present a glorious pathway for businesses to create brand awareness & increase engagement with prospects.
In this post, we'll help you understand Instagram Story analytics and how you can effectively track Instagram Story analytics for business growth.
Before we start with it, let's first take a step back and take a look at the importance of Instagram Stories for growing businesses.
In order to boost your company's Instagram presence, you need to analyze your content and find out what works best for your business.
Although Snapchat was the first major platform to popularize the 24 hours Story sharing format, Instagram has taken it to the next level.
Five years ago, when Instagram copied the whole Stories format from a direct competitor. The general consensus was that it was bound to fail. But the platform has proven everyone wrong with its exponential growth over the last few years.
Instagram Stories has revolutionized the social media industry, and now almost every social media platform offers Stories in one way or another.
Personally, the majority of my time spent on social media goes towards scrolling Instagram stories. With all the fun filters & tags, it's without a doubt addicting.
But what's in it for businesses?
As we mentioned above, Instagram Stories presents a unique opportunity for businesses to create brand awareness & increase engagement with prospects.
It helps in bringing a personalized touch to the way you engage with your prospects and customers.
Using Instagram story features like hashtags, mentions & public access, even people who aren't following you on the platform are able to see your content.
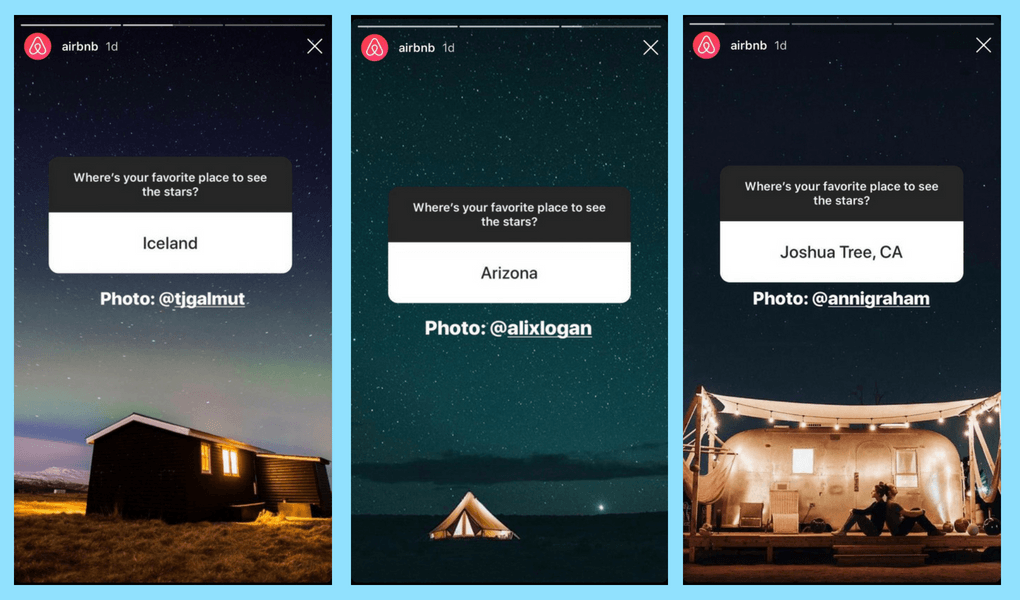
Also, using features such as polls, quiz questions & links, you can elicit a direct reaction from your audience.
Here are different ways you can use Instagram stories for your business:
We've written in detail about these use cases in this article. Take a look.
A Complete Guide to Instagram Stories
To check analytics for your Instagram Stories, make sure you have an Instagram business or creator account.
To view your Instagram Stories analytics,
Now select See All to see the Stories posted over the past 30 days
Select an interaction, such as Reach or Impressions, to get an overview of all the actions taken across your Stories
Instagram stories doesn't have your typical social media metrics such as likes, comments, saves, etc. They have their own set of metrics which are divided into three categories.
People use Instagram to discover new brands and products, and majority of people claims to be more interested in a brand or a product after seeing it in Instagram Stories.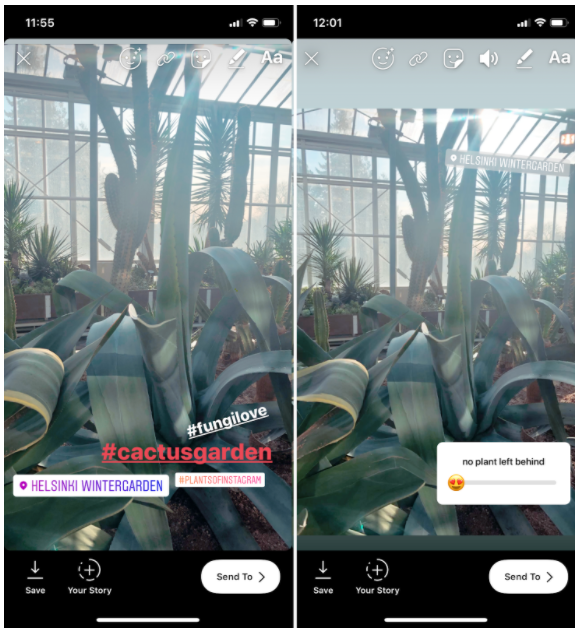
Navigation metrics give you a good idea of what's working for your brand & what isn't.
Forward Taps: Number of times people tapped to the next story
Back Taps: Total amount of times people tapped back to see the previous story
Next Story Swipes: Total number of times people swiped to the next story
Exit Story Taps: Total number of times people exited your story
Navigation: The overall total of Back, Forward, Next Story, and Exited actions taken with your story
Interaction metrics help you measure the engagement rate for your Instagram Stories.
Profile Visits: Total number of times your brand profile was viewed by someone who viewed your story
Replies: All the people who've responded to your story
Follows: Total number of accounts that followed you after viewing your Instagram, story
Shares: Total number of times your story was shared
Website visits: People who clicked the link in your bio after watching your story
Sticker Taps: Total number of taps on the hashtag, location, mention, or product stickers in your story
Calls, Texts, Emails, Get Directions: Number of people who performed one of these actions after viewing your story
Product Page Views: Total number of views your product pages received via the product tags on your story
Product Page Views per Product Tag: The number of views of a product page for each product tag in your story
Interactions: Total number of actions people took after viewing your story
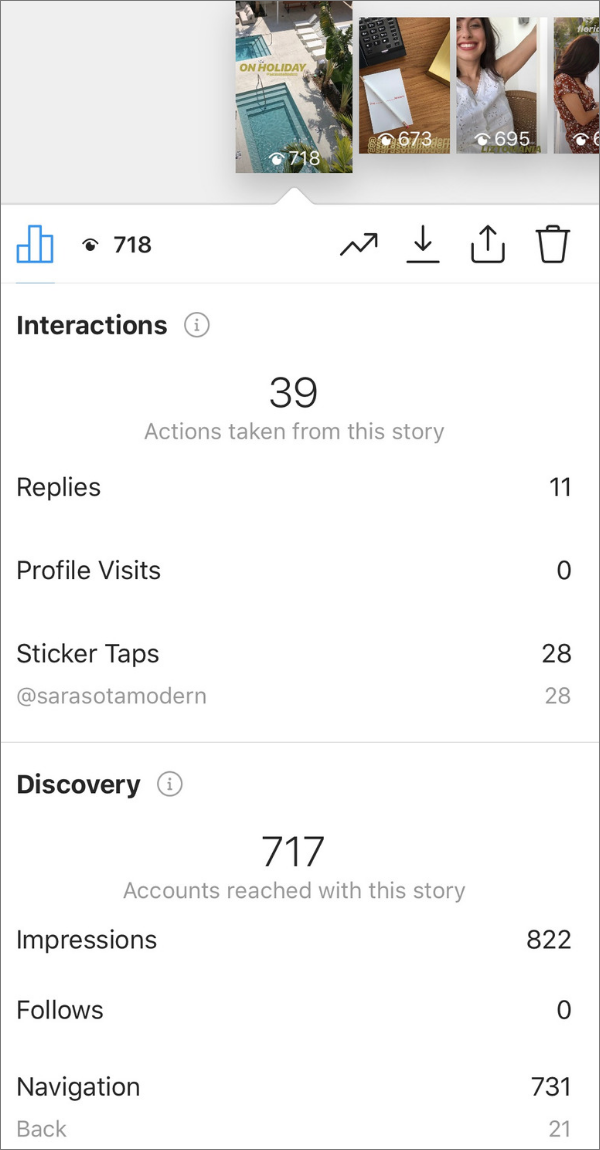
Statusbrew lets you review how people are viewing and interacting with the Instagram Stories that you published during a particular time period.
Statusbrew's Instagram Story Performance gives you an analysis of how your stories are performing w.r.t different metrics. You can also import Instagram Story Performance data by clicking on the three-dot menu beside the widget and selecting Export as CSV.
Click on View Details to expand each Instagram story and get detailed statistics along with a graphical representation of metrics with insights of the first 24 hours from the time story was published.
Statusbrew's Instagram Story Insights can be exported in the form of a PDF or a CSV (Excel) file.
Take a look at Statusbrew's detailed reporting options & claim your free seven-day trial for Statusbrew when you sign up.
Explore Statusbrew!
Statusbrew is an all-in-one social media management tool that supports Facebook, Instagram, Twitter, YouTube, Linkedin, and even Google My Business.!
Stories disappear after 24 hours. But with a solid understanding of Instagram Story analytics, you can ensure they have lasting impact.
With top of the feed placement, links, and interactive stickers, Instagram Stories are a prime channel for brands to drive awareness, traffic, sales, and engagement.
Learn how to measure Instagram Stories analytics and which metrics to track so you can optimize Stories to achieve your goals.
How to view Instagram Story analytics
Understanding Instagram Story metrics you should track (and what they mean)
More things you can measure with Instagram Stories analytics
How to optimize your strategy based on your Instagram Stories analytics
Download your free pack of 72 customizable Instagram Stories templates now. Save time and look professional while promoting your brand in style.
How to view Instagram Story analyticsThere are a few ways to check analytics for Instagram Stories.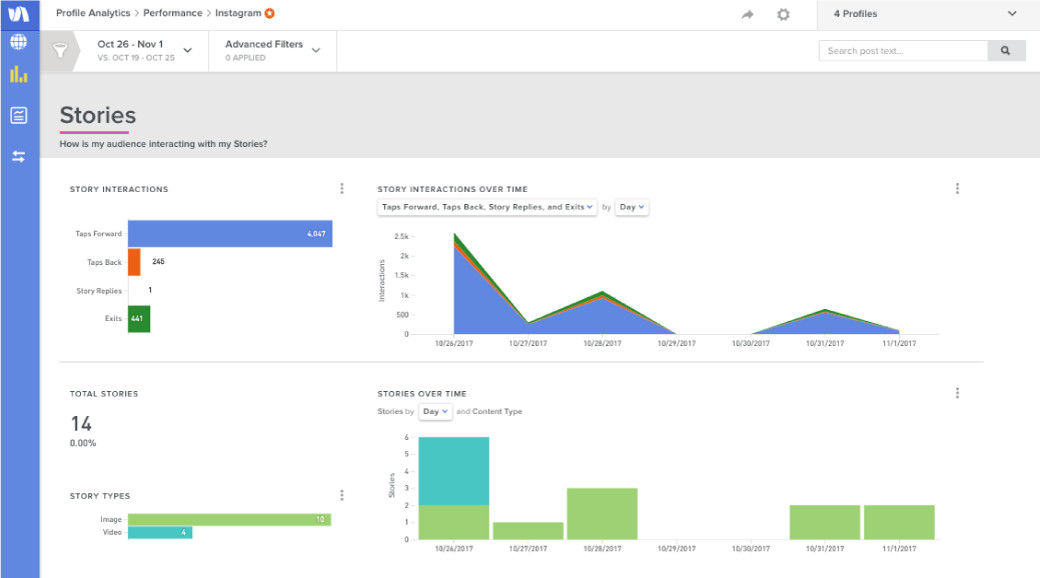 We break them down below. But first, make sure you have an Instagram Business or Creator account. Without one, you won’t have access to analytics.
Here, you will see all of the stories you’ve recently posted. The default time frame is Last 7 Days. Tap on it, to adjust the time period. You can choose from several options, ranging from Yesterday to Last 2 Years.
Then, tap the dropdown menu in the top left corner of the screen to select the metric you would like to access.
Available Instagram Stories metrics include:
Once you select your time period and metric, you can scroll all Stories to see how many interactions each individual Story collected.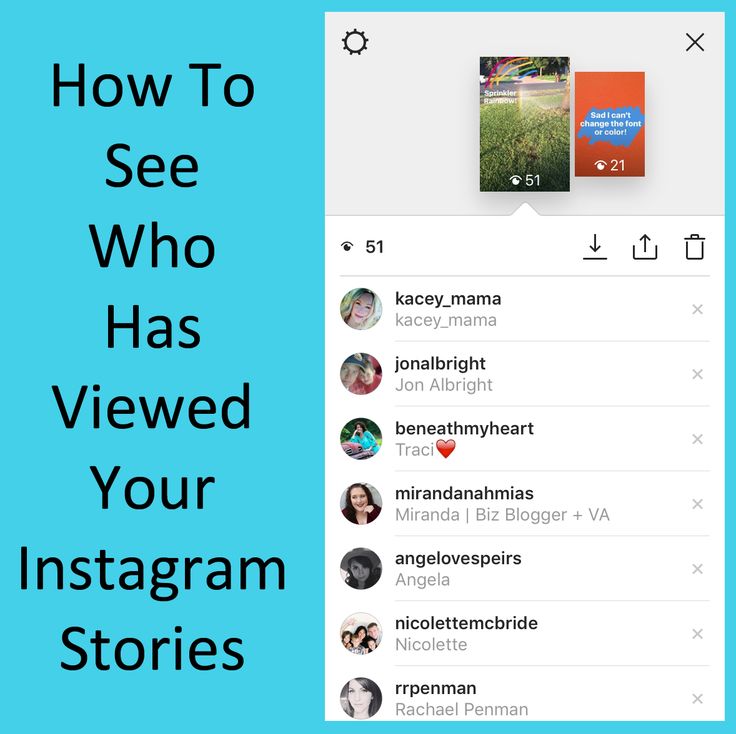
You can also tap on any Story and swipe up to view its detailed analytics.
To see the results of a poll or other sticker actions, click the eye icon beside the insights icon (it looks like a bar chart).
How to view Instagram Story analytics in HootsuiteTo view Instagram Story analytics in Hootsuite, add the Panoramiq Insights app to your dashboard. This simple add-on will give you access to in-depth Story analytics. With access to insights from all of your social media accounts in one place, you’ll have a bird’s eye view of your strategy at all times.
With Hootsuite, you can also export Instagram reports to CSV and PDF files — a feature that is not currently supported by Instagram’s native Insights tool.
Learn more about using Panoramiq apps with Hootsuite:
Other ways to view Instagram Story analyticsYou can also view Instagram Stories stats in Facebook’s native business dashboards. For more information, check out these resources on how to use:
Instagram Stories metrics are split into three categories: Discovery, Navigation, Interactions.
Instagram Story analytics: Discovery metricsWhy discovery stats matter: People use Instagram to discover brands.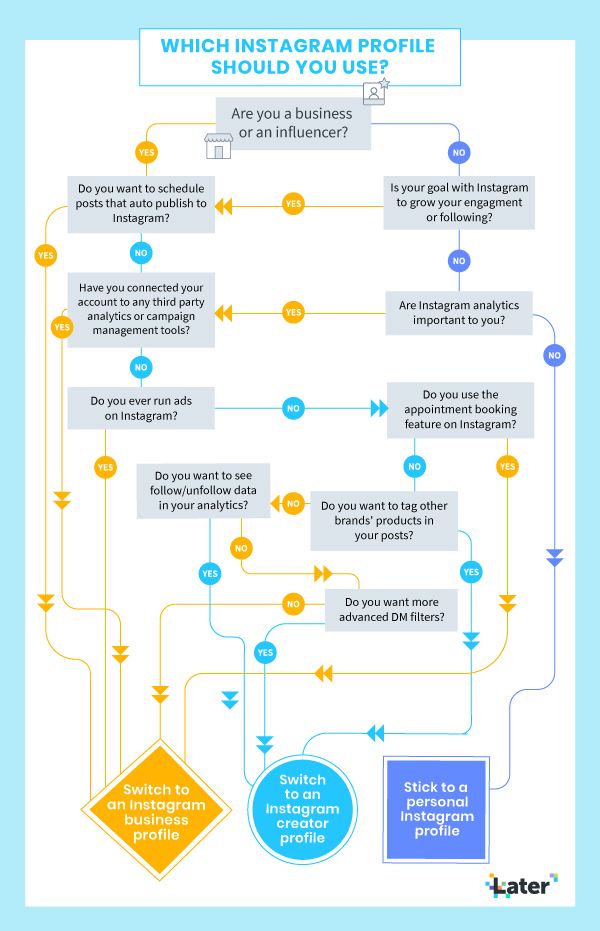 And 62% of people surveyed by Facebook say they’re more interested in a brand or product after seeing it in Stories.
Compare reach and impression numbers to your follower count to gauge how much of your audience is watching your Stories.
Tip: Add stickers to boost the discoverability of your Stories. When you use a hashtag or location sticker, your story is more likely to appear in Explore or the sticker’s larger story. If you run a small business, use the Support Small Business, Gift Cards, or Food Orders stickers.
Source: InstagramInstagram Story analytics: Navigation metrics
Why navigation stats matter: Navigation metrics show you what’s working and what isn’t. If a lot of viewers exit or skip to the next story, it’s a good sign your content isn’t capturing attention. Back taps, on the other hand, suggest your story shared content or info people wanted to see twice. This may also be a good one to save to your Instagram Story highlights.
Tip: Keep Stories short and sweet. People aren’t looking for long-form content here. A 2018 study by Facebook IQ found that Story ads performed best at 2.8 seconds per scene.
Instagram Story analytics: Interactions metrics
Why interaction stats matter: If your goals include engagement or other actions, interaction stats help you measure your success in achieving them. If your goal is to get more followers, compare Profile Visits with Follows. Did you want your story to drive traffic to your website? Website visits will show you how it fared.
Tip: Stick with one, clear call-to-action that aligns with your goals. Emphasize your CTA with branded stickers, or creative that emphasizes it. Facebook data found that highlighting CTAs drives significantly more conversions for 89% of studies tested.
More things you can measure with Instagram Stories analyticsHere’s how to measure Instagram Stories metrics like sticker taps, engagement rate, and more.
How to measure hashtag and location sticker performance on Instagram StoriesInstagram story stickers include hashtags, locations, mentions, and product tags. In other words, stickers are basically tags that viewers can tap to see related content. Like tags elsewhere, these stickers can also help a story reach a larger audience.
Sticker taps count as interactions and can be found under Interactions. If you haven’t used any stickers, you won’t see this metric.
How to measure engagement on Instagram StoriesInstagram story engagement metrics can be found under interactions. There’s no agreed-upon formula for measuring story engagement. But there are a few ways to think about it, depending on your goals.
Compare reach with follower countDivide story reach by the number of followers you have to gauge what percentage of followers are viewing your Stories. If one of your goals is to engage followers or promote awareness, keep an eye on this.
Total reach / Follower count *100
The average Instagram story view is 5% of your audience, said James Nord, founder of influencer marketing platform Fohr, in an Instagram Live interview with Matthew Kobach, manager of digital and social media for the New York Stock Exchange.
If you think this figure is low, consider promoting your Story with an Instagram post. Here’s an example:
Compare reach with interactionsView this post on Instagram
A post shared by Instagram for Business (@instagramforbusiness)
Divide total interactions by total reach to see the percentage of viewers who took action after seeing your story.
Total interactions / Total reach * 100
Compare reach with a key interactionFocus on the interaction that best aligns with your goal. If your call-to-action is to Follow Us, divide Follows by reach. This will show you the percentage of viewers who took the action.
Key interaction / Total reach * 100
Pro tip: Remember not to compare apples to oranges. Whatever way you choose to measure engagement, make sure you’re consistent.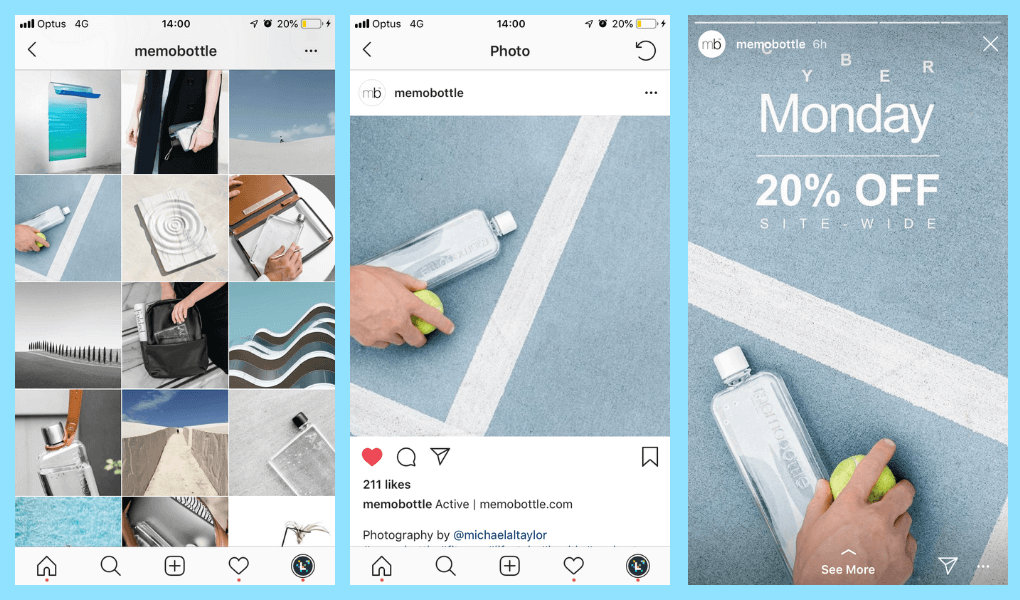 That way you can make fair comparisons and see what’s really working and what’s not.
Discovery is tricky to measure on Instagram Stories, since Instagram doesn’t differentiate between Instagram accounts that follow you and accounts that don’t.
Reach shows you how many people are watching your Stories. But to drill down on discovery, keep an eye on Profile Visits, Follows, and Website Clicks. These metrics measure viewers who likely weren’t following you, but liked your story enough to check out your profile, hit the follow button, or visit your website. Watch Shares, too. A share is a great way to be discovered, and could drive more follows.
Instagram recently introduced Growth Insights, which allows you to see which Stories and posts earned the most followers. To check these insights, go to the Audience tab in Instagram Insights.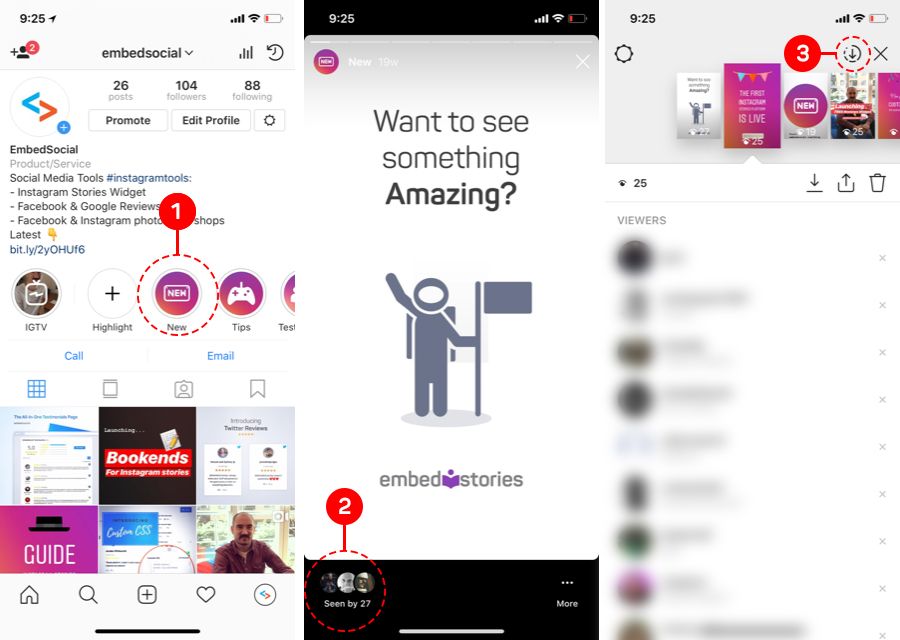 Scroll down to Growth where you’ll find a chart that shows you follower changes by day of the week.
Don’t forget your stickers. Check the viewer numbers of other Stories associated with your stickers under Viewers. But act fast: this data is only available for 14 days. Keep track of the stickers that bring the most viewers.
How to measure traffic from Instagram StoriesCompared to most social networks, Instagram doesn’t offer a lot of places to refer traffic outside of the app. Brands were stuck with “link in bio” call-to-actions until Instagram rolled out the Swipe Up feature for Stories.
It’s tricky to measure how many people Swipe Up. The best way to do it is to add UTM parameters. These are short codes you add to URLs so you can track website visitors and traffic sources.
Tip: Highlight Stories with links so people can keep swiping outside the 24-hour window.
You can also track Website Visits.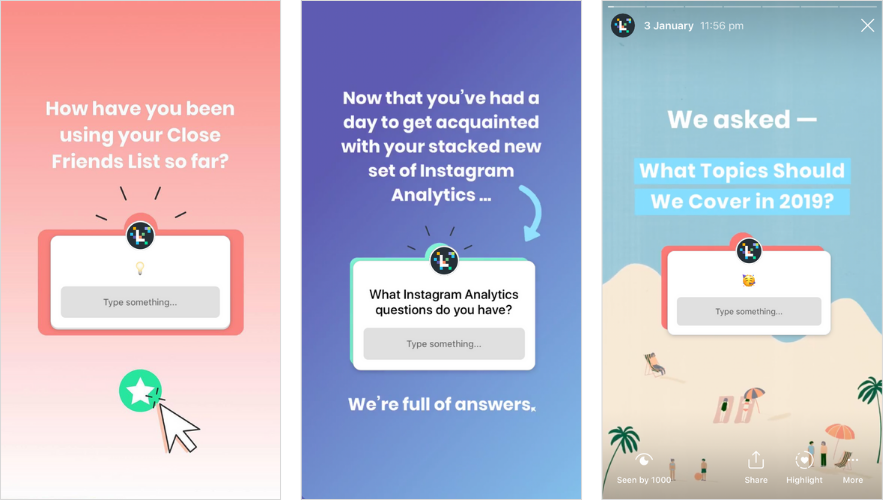 This measures how many people visit the link in your bio after seeing your story.
The Swipe Up feature is only available to accounts with 10K+ followers. Here’s how to earn more followers on Instagram if you need help hitting that number.
Download your free pack of 72 customizable Instagram Stories templates now. Save time and look professional while promoting your brand in style.
Download the templates now!
How to see when your audience is most activeInstagram Stories are only live for 24 hours, unless you add them to your highlights. Post them when your followers are most active to ensure they don’t go unseen.
Follow these steps to see when your audience is online:
These are the best (and worst) times to post on Instagram.
How to track Instagram Stories you are tagged inInstagram recently made it easier for creator and business accounts to track story mentions.
Now you can see any story that mentions you at the top of the Activity tab. To access Stories About You, tap the heart icon, then Mentions under Stories About You. From there you can look at each post, add them to your own Stories, or simply thank them for the love.
Source: @InstagramforbusinessThis includes when people use the Support Small Businesses sticker. Right now, Stories that use this sticker are added to a larger story that appears at the top of feeds. If you run a small business, be sure to benefit from the added exposure.
How to optimize your strategy based on your Instagram Stories analyticsHere’s how to use Instagram Insights to inform a great Instagram Stories content strategy.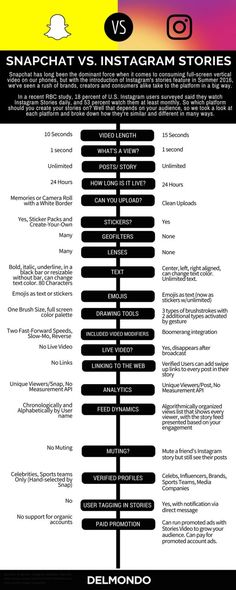
Understanding how your Stories are performing over time will help you pinpoint top performing posts. If you spot photos and videos that outshine other Stories, look for ways to recreate it.
Turn successful ideas into concepts. Run polls or quizzes around different themes or spin a successful tutorial into a recurring series. For example, Culture Hijab posts regular tutorials on different ways to wear hijabs.
Source: @culturehijabOn the flip side, don’t panic if something flops. Stories are an ideal place to experiment and learn. Fortunately, if an idea doesn’t take off, it disappears in a day.
Need some inspiration? Pick up tips from 7 of the best brands on Instagram Stories.
Listen to audience feedbackQualitative data is just as important as quantitative. If you’ve used poll, quiz or question stickers to engage your audience, pay attention to responses.
Use feedback to inspire new products, services or content. And don’t be afraid to ask directly. People like having their voices heard. The LA County Museum of Art recently ran a poll that asked viewers to share what content helps them de-stress. Then it gave the people what they wanted: Cats.
Learn how people prefer to communicate with youView this post on Instagram
A post shared by Instagram for Business (@instagramforbusiness)
Between stickers, replies, and call buttons, there are lots of ways for followers to get in touch with you. But some options may be preferred over others.
Take a look at Call, Text, and Email metrics to see if one stands out. If you’re getting more emails than calls, adjust your call-to-actions (and support services) accordingly. You might just see more bookings, orders, or inquiries as a result.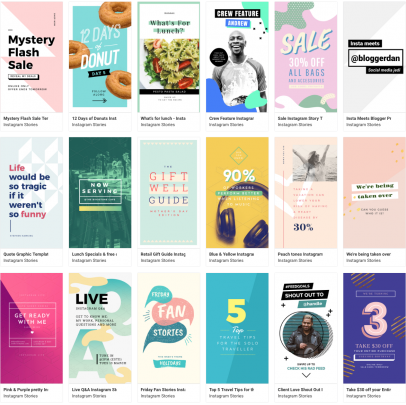
It may seem like a minor tweak, but communication methods can be a hang-up for some customers. Sometimes it’s generational. Millennials have been accused of avoiding phone calls. Non-native language speakers may feel more comfortable over email.
me, a millennial, exhausting every possible option in a situation other than making that quick phone call:pic.twitter.com/ZG9168DeFZ
— J.R.R. Jokin' (@joshcarlosjosh) February 24, 2020
Don’t ignore Replies, either. If people are sliding into your DMs, it may be time to organize your Instagram Inbox. Professional accounts have access to two-tab inboxes. Move messages between Primary and General tabs to ensure you get back to people efficiently.
Ready to start scheduling Instagram Stories and save time? Use Hootsuite to manage all your social networks (and schedule posts) from a single dashboard.
Get Started
Easily create, analyze, and schedule Instagram posts, Stories, and Reels with Hootsuite. Save time and get results.
Free 30-Day Trial
To prevent this from happening, analyze which topics and story formats received the most views and responses, and which, on the contrary, scrolled forward because they were not interesting to subscribers. Some of the statistics can be obtained in the Instagram application, however, it has two big drawbacks:
Few metrics to analyze. For example, you can see how many users clicked the back navigation to return to previous stories. But you can’t look at the “Forward” navigation to understand which stories they want to scroll through faster, which means they are not interesting for subscribers. It is also impossible to estimate the percentage of views of stories, and this is an indicator of keeping the attention of the subscriber and, accordingly, the quality of the content.
Stories cannot be rated by several parameters at once. For example, you decided to experiment and introduce a new category - "Overview of stores". To understand how good a rubric is, you need to collect statistics on all stories from the rubric and display the average and total values. It often happens that some individual stories get a good response, but the rubric as a whole is weak. Well, then compare the statistics for the new rubric with the statistics of other rubrics.
You can carry out such an analysis manually: switch each parameter in Instagram statistics (impressions, reach, replies, etc.) and write data for each story to the table. This is inconvenient and takes a huge amount of time. You can simplify the analysis of stories, save time and get advanced statistics in LiveDune.
Contents
How to increase reach with LiveDune stats
How to increase stories reach with games and surveys examples
How to increase reach with LiveDune stats
 To do this, you can conduct polls and quizzes, arrange games, or even ask for reactions to selective stories. But doing this every day is not an option, as it will quickly begin to annoy subscribers and can backfire. Therefore, start with an analysis, it will give an understanding of what is already working well, what can be improved, and what should be abandoned.
 This is the total number of views of your stories.
The number of unique users who viewed your stories. For example, your friend has watched stories 3 times. In statistics, this will show up as 3 views and 1 reach.
The total number of emojis and messages sent in response to your stories. The more reactions you get from users, the closer to the start of the issue the algorithmic feed will show your stories.
The number of times the user moved to the next story without viewing it to the end (i.e. less than 15 seconds).
The number of times the user went to the previous stories to watch it again.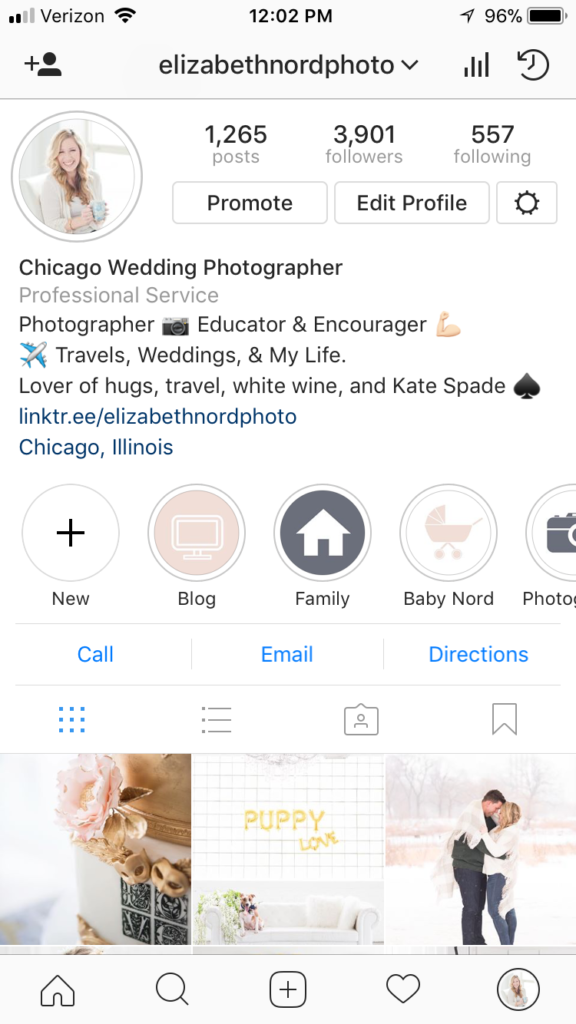
Number of clicks on the cross in the right corner of stories. That is, when viewing your stories, the user left the stories feed.
Percentage of users who viewed stories from start to finish.
Ratio of stories coverage to account subscribers.
Finding the most successful stories
Reach, Responses, and Views metrics will help you find your best stories. To do this, on the “Stories” tab on the table of the same name, line up the tops according to these metrics. Click, for example, on "Coverage" once (down arrow) and the stories are sorted from largest to smallest. Do the same with the "Responses" and "Inspections" metrics.
Analyze the top stories, try to understand what they have in common. Perhaps they have one category (topic) or format (image, video, repost). Maybe it's the content - you added music to them or duplicated the words you say in stories with text so that you can watch it without sound.
Finding the worst stories
There are two ways to find the worst stories. First, build the antitop according to the Reach, Responses, and Views metrics (double-click on the desired metric - up arrow). Also try to find out what they have in common. Next, build a top according to the Forward and Exit metrics. They mean that when viewing stories, users often scrolled through them or even left the stories feed, perhaps because they were not interested in them.
Build top/anti-top rubrics
Add stories to find the most successful and unsuccessful topics. To do this, in the "Stories" table, click on the empty circles and set the heading for each stories, put a color on it to make it easier to navigate. Next, analyze the top and antitop rubrics in the Rubrics table. Similarly, find the most successful and unsuccessful topics of stories by "Inspections", "Reach" and "Answers". It is preferable to look at the last two metrics by the average, because the total number of stories in a rubric may differ. The top and anti-top in terms of Reach Rate will match the results in terms of the average Reach, so it can not be analyzed separately.
What to do next
After a detailed analysis, you will be able to understand which stories your audience likes and should be published more / more, and which ones are ignored and should be removed from the content plan as soon as possible. For example, in the course of your analysis, you found that stories in the video format are watched the most, and the sections “Poll” and “Travel” receive the most responses. These are your best stories, you can post them more often, or experiment and create related topics. The section “Building a house” turned out to be an outsider in terms of answers, but it was in the top in searches. It is not worth excluding this section, it is better to try to ask a question, ask the audience for advice. Usually the public is happy to help, for example, recommend specialists or tell about their experience. In this way, you will increase the number of responses and thereby reach.
If you don't host games or surveys, be sure to fill in this blank. Firstly, this will diversify the content, and secondly, increase the coverage, because such formats imply user interaction with stories.
How to increase the coverage of stories with games and polls: examples
Spot the difference game To do this, place one version of the picture on the first stories, and the second on the next. Next, ask users to write their answers, who found what. You can do this with the help of the "Questions" sticker.
Effect:
Users click stories back and forth, pinch stories to see differences, and submit responses. All this is beneficially perceived by Instagram algorithms and increases your reach.
Ask for an emoji reaction. You can do this with the Poll sticker or just send it in response to stories. The main thing here is that the theme of stories really evokes emotion and users want to react to it.
You can add emoji by adding text to stories. To do this, click on the “A” icon and add the desired emoji to the row instead of text. And if you want to go crazy and add animated emoji to your video so that they attract more attention, see the video tutorial below.
Effect:
Users are more likely to watch stories and leave a reaction. It will also have a beneficial effect on reach.
Enter a permanent rubric where you ask the audience to make a choice. It doesn't need to be complicated, it should be simple. For example, choose a photo of the day, an image for work, etc. The main thing is to place the first version of the photo on one story, and the second on the other, so that the audience uses the Back navigation.
Effect:
they are used to it, and since the author asks, then their opinion is important.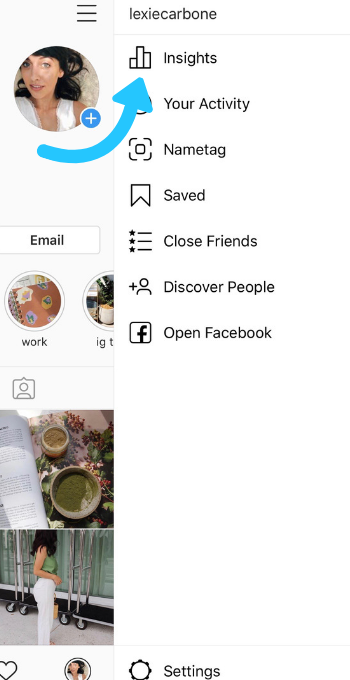 They are happy to choose by clicking “Back”, and perhaps pinching stories to view it, and voting, because this choice does not oblige them to anything.
Game find active sticker. Ask users to find, for example, an active emoji. To do this, place one real poll sticker and many fake ones in the form of a picture (to remove the background, use MagicEraser for iOS or Background Eraser for Android).
Impact:
Stories will get a high percentage of clickthroughs, as well as the use of back navigation, as some users will not be able to find the active emoji in 15 seconds.
Even more games you will find in our article - Games to engage followers on Instagram. Also hold contests and polls, all this will diversify standard stories and increase coverage.
Only important news in the monthly newsletter
By clicking on the button, you agree to the processing of personal data.
What's new in SMM?
Subscribe now and get an Instagram account audit guide
Popular articles
≈ 4 min to read 23. 07.2020
How do I use my Instagram best friends list for marketing purposes?
With the help of stories for best friends on Instagram, you can not only limit the circle of people who will see your stories, but also hold a closed marathon, create sales chains or run a competition through and through.
#instagram 09/18/2019
Where to look for Instagram content ideas
8 adequate ways to find content ideas for Instagram when there is nothing to post.
#instagram 09.09.2019
How to make ad layouts for stories
A selection of apps for creating videos and animated ad layouts for Instagram stories.
#instagram 04/09/2019
11 video editing apps In order for the video to cause admiration and reactions from subscribers, you need to process and edit it beautifully.
LiveDune Marketing Products - 7 days free
Our products help optimize your social media experience and improve your accounts with the help of deep analytics
Analysis of your own and other people's accounts using 50+ metrics in 6 social networks.
Account statistics
Message processing optimization: operators, statistics, tags, etc.
Direct Instagram
Automatic reports for 6 social networks. Upload to PDF, Excel, Google Slides.
Reports
Monitoring the progress of KPI for Instagram accounts.
Audit of Instagram accounts with clear conclusions and advice.
Express audit
We will help you to select "pure" bloggers for effective cooperation.
Checking bloggers
.
Instagram account statistics could only be viewed using third-party services and programs, but now it can be done in your own account and even from a computer to Facebook in Creator Studio. Where is this statistics and how to do it on Android and iPhone?
Instagram statistics for the account as a whole, individual publications and Stories can be viewed for free, but first you need to create a business account or an author account.
👉 How to make a business account on Instagram
You will have photo and account statistics after switching to a business profile or author account . You can do this for free. Previously, it was necessary to link the Facebook page. But now this can not be done.
But in order to run ads directly in the application, Facebook still has to be linked. To do this, you need to remember your e-mail and password from your Facebook account, as well as create a public page for your business account.
After transferring to a business account or an author account, you will see the inscription “View professional panel” at the top and the “Statistics” button.
If you immediately click the button, then you will immediately go to the Statistics of your Instagram profile.
If you click "View professional panel" - then you can see all the tools for working with a business account / author account. Including there will be a line "all statistics".
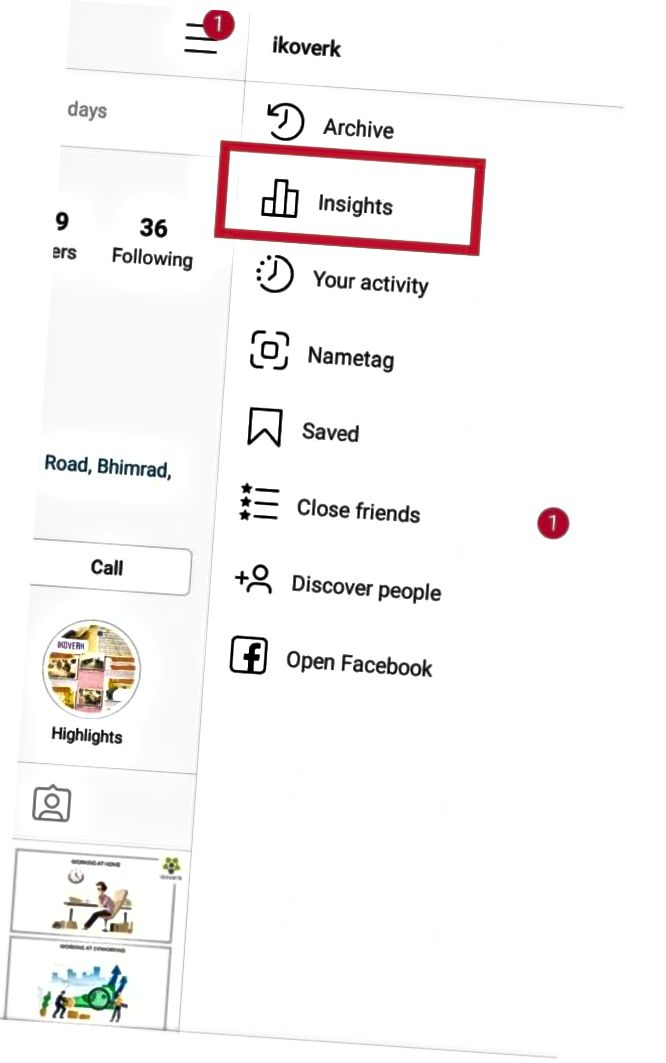
The third way to view Instagram statistics - in your account, click the three bars at the top right and select "Statistics"
Instagram account statistics can only be viewed from the current moment. Everything that happened before, no one will ever know =) Therefore, you will see some intelligible statistics for the entire account within a week, and only new posts will have photo and video statistics.
Statistics are needed not only to track the progress of an account, but also for potential advertisers who ask for Account Reach and Engagement before buying ads. What does Instagram stats mean?
On the main screen, you can select a period from the top - statistics for the last 7 days or 30 days.
Accounts Reached - is the total number of people who saw your posts, Stories and IGTV) in a week, plus a comparison with last week. It differs from Impressions in that here each person (account) is counted only once, even if he watched your posts several times. Therefore, Reach will always be less than Impressions.
👉 Instagram reach: what is it and how to increase it?
Click on Covered accounts and more detailed statistics will open.
Subscribers and everyone else (by reach) - how many of the audience covered were subscribed to you, and how many were not.
Content type - which content received the most coverage (also broken down by subscribers and unsubscribers)
Here you can also see which posts were the most popular in terms of reach. And if you press the triangle bracket 9 on the right0009 > , then you can filter statistics on Instagram by other indicators (comments, likes, subscriptions, etc.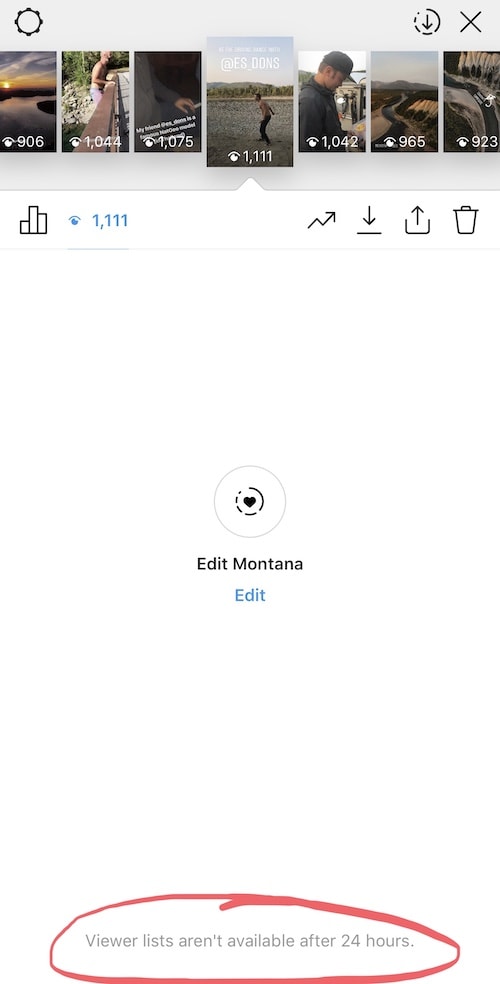 ).
).
Impressions is the total number of content views. One person could watch several times, different content. Therefore, impressions are always more reach.
Actions in the profile are visits to your Instagram account plus clicks on the buttons in the account header (e-mail, store, phone, etc.).
YOUR AUDIENCE
Return to the first Instagram Insights screen. In the "Your Audience" section, click the triangle bracket on the right > . Statistics on subscriptions and unsubscribes on Instagram will open.
Increase - on this graph you will see the number of subscribers, unsubscribers and total (subscriptions minus unsubscribes).
Below are statistics by location, age and gender.
Peak periods - time (days and hours) when followers were most often on Instagram.
CONTENT YOU POSTED
Return to the first screen of Instagram Statistics. In the "Content you've posted" section, you'll see the number of posts/Stories/IGTV/Promotions in the last 7 or 30 days (depending on the filter on the top left). For each type of content, you can filter by all engagement indicators (impressions/reach/likes (likes)/comments/saves).
This will help you better understand the results of advertising from bloggers or giveaways. But this is only available for profiles with more than 10,000 subscribers. You can wind them up and go to the author’s account, especially if you don’t have enough 1000 subscribers and can’t wait to get new statistics right now. This will not hit the account engagement much. But ideally, of course, you need to grow organically, with the help of advertising from bloggers and targeting.
To find out the statistics of views (and not only) of each publication - photo or video on Instagram, you need to open the desired post and click "Statistics".
The top line of statistics is the number of likes, comments (👉 Comments on Instagram: how to talk subscribers), transfers to Direct and saves.
Saves - how many times the "save" button was pressed.
Visits to profile - how many times they went to the account from this photo.
Reach - how many people viewed the photo. On average, there should be 30-60% of subscribers. Less - a lot of bots that do not look at posts. More — if you ran an ad, got featured, the post turned out to be very popular, shared, etc. The larger your account, the smaller the reach in % of subscribers. Old followers abandon accounts or lose interest. This is fine. The highest coverage (in % of subscribers) is for accounts with up to 1000 subscribers. To increase your reach, be sure to post regularly, with a content plan. Even according to the coverage statistics on Instagram, you can understand whether you published a post at the right time or not.
If you swipe up on these statistics on Instagram, you can find out even more interesting things about the statistics of the post.
Profile visits - how many people went to your account after seeing this post
Reach - how many people saw your post.
Impressions - how many times your post was viewed. One person can view multiple times, so impressions are always more than reach.
From main page - how many people saw the post in the feed
From "Interesting" - views from the recommended tab, with a magnifying glass. The more, the more likely that the post has become "viral" (it is sent to friends, it appeared in the recommended). Also, a large percentage happens if you promoted a post.
From profile — how many people saw the post by logging into your account
From hashtags — how many came from hashtags
From “other” - all other sources
In a personal account, you can only see the total number and accounts of those who saw your Stories.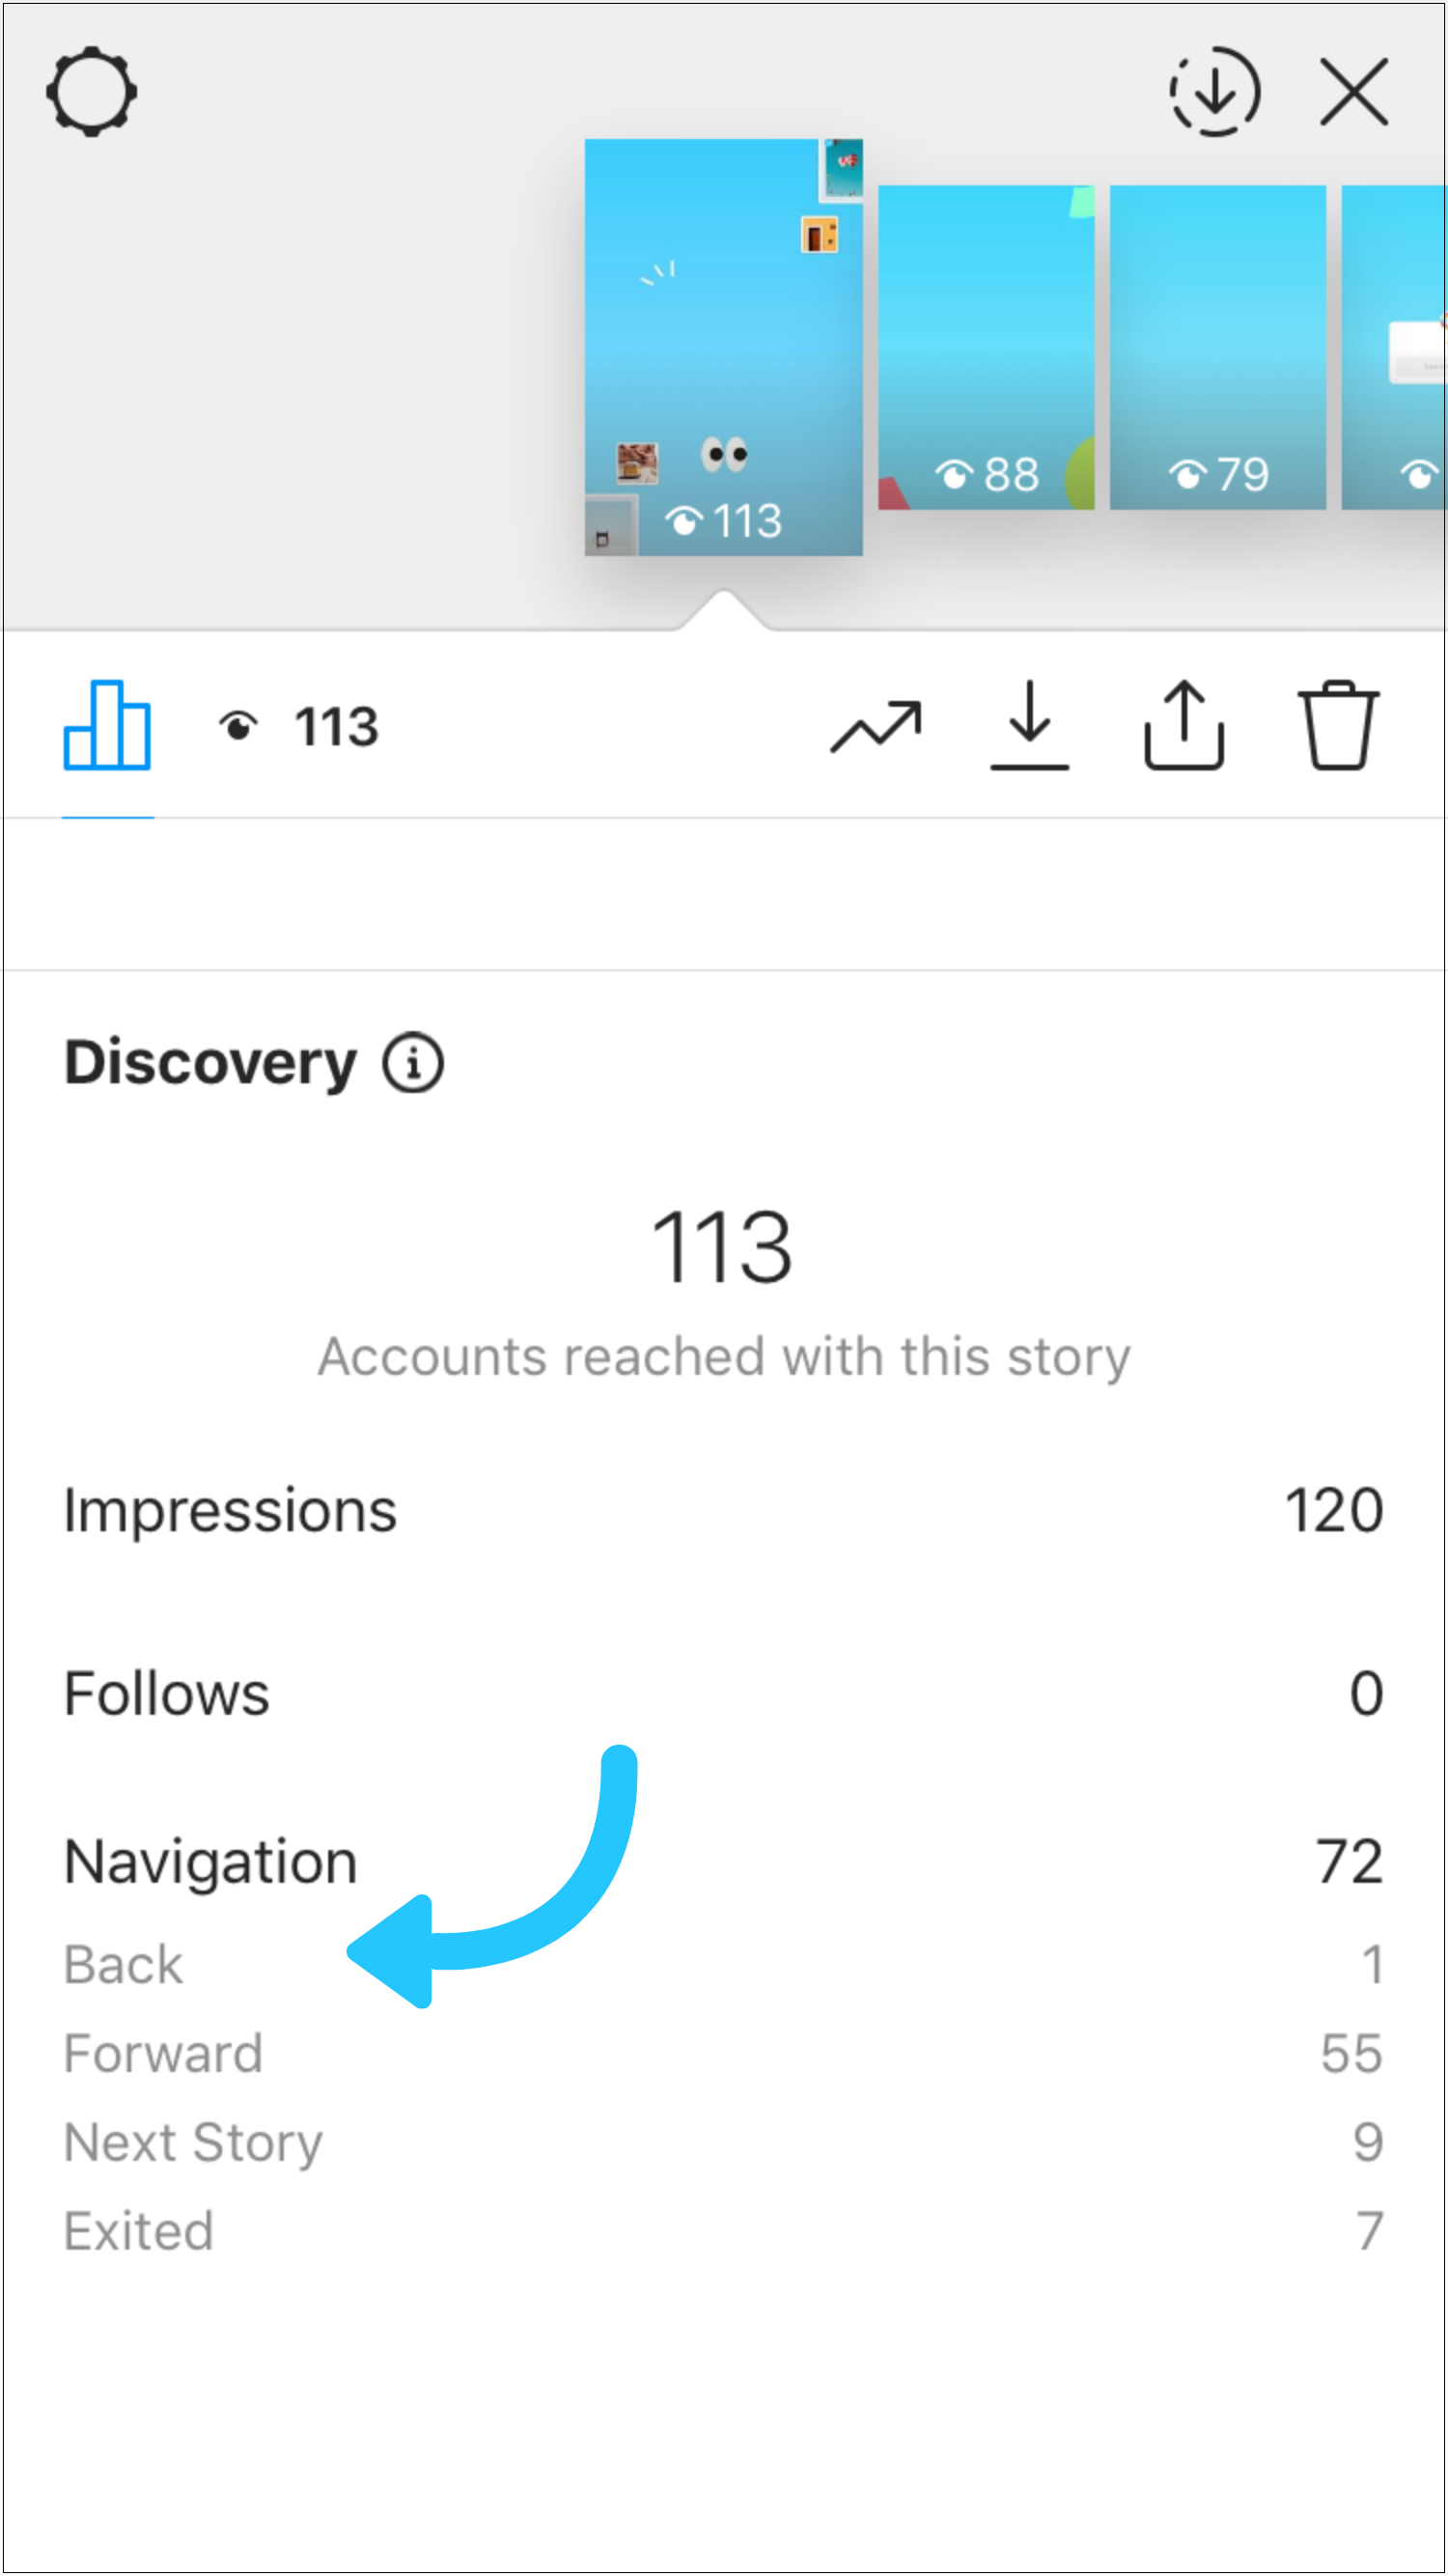 To do this, swipe up from the bottom of any Story on Instagram.
After switching to a business or author account, you will have detailed statistics for each Stories on Instagram. What does each statistic mean?
INTERACTIONS
Total statistics on the number of reactions to your Stories:
Replies — how many people answered you in Direct on this Story
Clicks on the link — how many times after this Story they went to your account and clicked on the link in the description.
Visits to profile - how many times after this Story they went to your account.
REACH STATISTICS
Here you will see statistics on how many people see your Stories and how they find them:
Accounts covered by this Story (Reach) - the total number of people who saw this Story
Impressions - the number of times this Story was viewed .
Subscriptions — how many subscriptions after this Story.
Navigation = back + scroll forward + jumps to next story + exits
back - number of taps back to your previous story0003
Forward - number of taps forward to view your next Story
Next Story - number of scrolls to the next account's Stories. Here you can understand whether was interesting or not was History , whether the person wanted to watch your content further or moved to the next account.
Exits — number of exits from the Stories view mode. Again, you can see the statistics of how the Story was able to keep the attention of subscribers.
Do not draw conclusions after the first week, how to connect free statistics on Instagram. Check how it will change for at least a month. Compare weekdays, weekends and holidays, good/bad weather outside.
Don't be in a hurry to "give it all away" if your coverage dropped in late spring and summer. Previously, no one had such statistics, and people who do not know the general trends in social networks and the Internet are afraid of fluctuations in statistics in their Instagram account. In the fall and after the New Year holidays, there is always an increase, and in the spring and summer there is an outflow. Of course, this does not apply to "seasonal" businesses (spring-summer travel agencies have growth, for example).
Even though many of us have a smartphone as an extension of our hand, we still scroll through Instagram less when we are on vacation, it’s summer outside, etc. Therefore, do not rush to arrange another giveaway or pour extra money on advertising if your coverage decline is seasonal. But do not abandon your account, if necessary, make pending posts for the holidays. Then even if you yourself are resting, you will still flicker in the feed of subscribers.
You will have the most reliable statistics a year after you make it.