Instagram Insights shows you engagement analytics that empower you to improve your Instagram for Business strategy.
You no longer have to guess about what works for your audience; Instagram Insights will tell you. You’ll therefore be able to get more likes, earn more followers, and grow your profile exponentially.
In this post, we’ll go over everything you need to know about Instagram Insights and how to leverage it to improve your Instagram profile.
Instagram Insights is a feature that allows Instagram Business Account users to see analytics related to their profile and posts. From this data, you'll be able to identify what your audience likes and engages with the most to improve your Instagram strategy.
Instagram Insights allows you to get access to important user engagement data for your business profile. It’s not just enough to know the raw numbers, such as the amount of likes you get for one post. It’s important to understand your audience, too.
That’s where Insights comes in. It tells you how they do things, what they prefer, and who they are. You can certainly make business decisions based on gut feeling, but you're much more likely to hit the mark when you can validate assumptions with cold, hard facts.
Data and analytics help you measure the impact of your marketing efforts across different channels to see if there's something you need to do differently — like target a different audience, post at a certain time of day, or experiment with a new content format.
Social media isn't any different from other aspects of your marketing in the sense that it can be measured and improved upon. That's why you'll be able to create a more effective Instagram strategy using Instagram Insights.
To use Instagram Insights, you must first have a business profile. The good news? If you're already using a personal account, you can switch to a business profile right from your phone. Here's how to convert your account in a few simple steps.
You can convert your Instagram profile to a Business account directly from your Instagram mobile app. First up, open up the app and click on your profile picture on the bottom right-hand corner of your feed.
Next, it’s time to head to Settings. On your profile, click the hamburger icon on the top-right corner.
On the pop-up, click “Settings.”
 Tap "Account."
A list menu will come up. Tap “Account.”
By switching to a Professional account, you can get access to Insights immediately — even if you’re not a business.
Choose the best category that describes you. Once you’re finished, click “Done.”
After, go back to your profile. Here’s what it will look like:
As you can see, you can immediately access Insights with a Professional account. If you’re a freelancer or content creator, you can stay as is, or you can take the extra step of switching to a Business account.
If you’re a business, organization, or brand, you’ll want to take the additional step of turning your Professional account into a Business account. A Professional account gives you full access to Insights, but is designed for independent digital creators. A Business account is more apt for companies.
Note that turning your account into a Professional account always comes before switching to a Business account.
To turn your account into a Business account, click the hamburger menu in the top right corner of your profile. Click “Settings,” then “Account.” At the bottom, click “Switch Account Type.”
Then click “Switch to Business Account.”
Done! You’re now a Business account with access to Insights.
Lastly, if you have a Facebook Business page, it’s important to connect it to your Instagram Business or Professional account. To do so, go to your profile and click the “Edit Profile” button.
Under “Profile Information,” click “Connect Facebook page.” Follow the prompts to connect your Page or create a new one.
Be sure to already have a Facebook account prior to connecting your page. Click here for instructions for setting up your Facebook Page if you don't already have one.
Once you’ve set up your Professional or Business Account, you can begin to use Instagram Insights.
Before we get into specific instructions for using it, however, here are the analytics on this channel that marketers need to know and understand — and how to use them.
Let’s look at Instagram Insights from a bird’s eye view and zoom in piece-by-piece.
Insights Overview is the “home page” of Instagram Insights. Here, you’ll see how you’ve fared overall.
You get several pieces of information on this page:
Now, let’s go into “Accounts Reached,” “Accounts Engaged,” and “Total Followers” in more detail.
In Accounts Reached, you’ll see more specific information about the users who have seen your content and interacted with your profile in some way or form.
Lets’ break down the different pieces of information you’ll find in this page.
 You can see the number of website taps, business address taps, call button taps, email button taps, and text button taps. For these metrics to show up, however, you have to have set up those buttons.
Accounts engaged refers to the number of users who interacted with your content beyond just watching it or scrolling past it. Let’s break down the sections on this page.

The total followers page of Instagram Insights allows you to see the total number of users who follow you. You can also see follows, unfollows, top locations, age ranges, and genders.
Under total followers and its demographic breakdown, you’ll then see one more section: most active times.
To see post insights on Instagram, navigate to your Instagram profile and click the button that says “Insights” right above your posts. Alternatively, click the hamburger menu on the top right-hand corner and tap Insights. There, you’ll be able to see Insights for all of your posts, reels, live videos, and more.
Next, let’s go over how you can see insights for individual posts on Instagram.
If your Story is currently live on your profile:
If your Story has already expired or more than 24 hours have passed:
If you’ve just finished your Live video:
If you broadcasted your Live video in the past:
Next, we'll get into how to use Instagram Insights in your day-to-day.
Instagram Insights is a fantastic tool, but it can be hard to know what to do once you gain access. Here are some of the most useful ways you can use Insights as you grow your Instagram profile.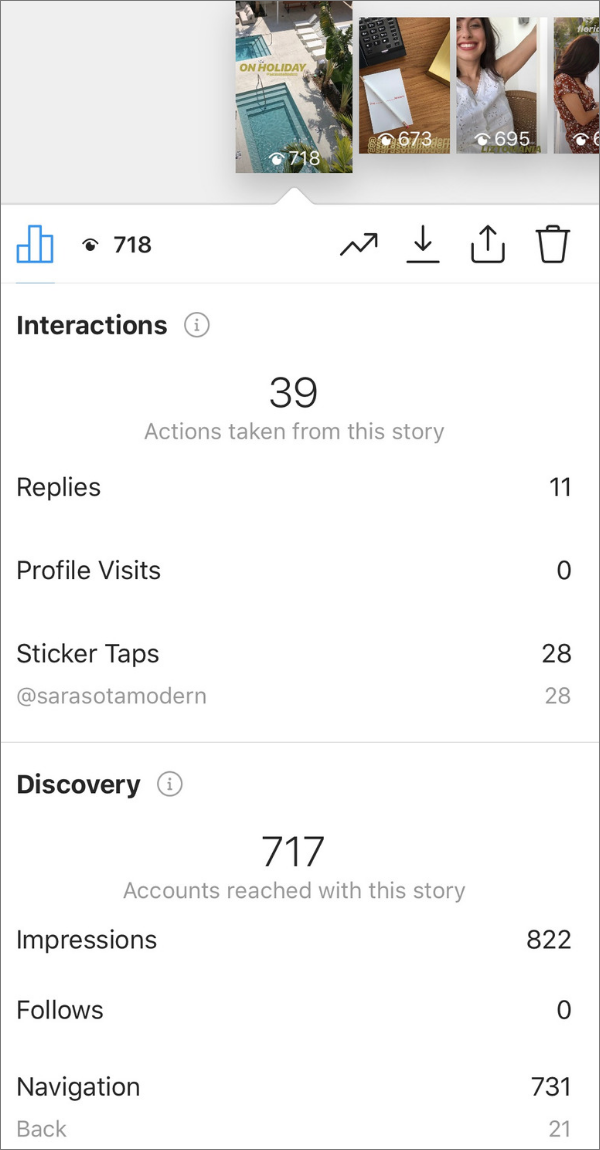
Click the Accounts Reached section. As mentioned, reach reflects the number of unique users that have seen any of your Instagram posts.
Within this category, you'll see insights for:
Some of these insights can be expanded for more insights.
On the Accounts Reached page under Account Activity, you'll be able to see Profile Visits.
Profile Visits reflects the number of times your profile has been viewed.
Find out how many of your profile visitors are turning into followers by dividing your number followers by the number of visitors. Track this number over time to find out whether your “conversion rate” is increasing or decreasing.
Website Taps can also be found under Accounts Reached > Profile Activity. This insight reflects the number of times any links you've included in your business profile have been clicked.
Navigate back to Insights Overview and tap Accounts Engaged. This will bring up a page that shows how your content is performing in terms of engagement, breaking down the metrics by content type.
Likes speaks for itself, reflecting the number of users who liked your post. As with likes, Comments reflects the number of comments left on your post. Saves highlights the number of unique users or accounts who saved your post. If any of these numbers are low, it’s important to reevaluate your Instagram strategy.
Navigate back to Insights Overview and click Total Followers. You'll then reach the Follower Breakdown page.
This page reflects how many followers you've gained or lost over the past week, as well as the average times of day when your followers are using Instagram — data that can be highly beneficial when planning posts.
To view insights for a specific Instagram post, start by visiting your profile. Tap on the post you'd like to look into, then click View Insights below the image
Under the “Profile Activity” section, you’ll find out the number of actions that users took on your profile as a result of seeing your post — things like visiting your profile, then taking an action like clicking on your website link or following you.
Previously named “Discovery,” Reach indicates where your post was seen — or discovered — the most, including how many accounts weren't already following you when they first saw the post.
This section includes metrics on Impressions, which reflect the number of times your post was discovered from a particular place within Instagram, like the user's home feed, a search, your profile, a location tag, or a hashtag.
Reach insights also include data on a post's reach — which reflects the number of unique accounts that saw your post.
Instagram users with a business profile are able to view insights into their ephemeral Stories.
To view your Story insights, navigate back to Insights and scroll down to Content You Shared section on the Insights Overview page.
Scroll down to the Stories section, and you'll be able to see insights for older stories, as well as any that have not yet expired.
Next, we'll get into the more specific insights you can explore.
This insight represents how many times your Story was seen.
When viewing these insights, keep in mind that you're able to add multiple images or videos to your Story. When you do this, every piece of visual content in your Story is counted as a single photo or video in your post.
Let's say you add six photos to your Story. Whether someone only views one or views all six, Instagram only counts your entire Story having received one impression.
The same goes for Story content that has been viewed by a single user more than once. Instagram still only counts that interaction as the entire Story having received one impression.
This insight reflects the number of unique users that have seen your Story.
This insight reflects the number of times a user taps your Story photo or video to skip to the next piece of media.
This insight reflects the number of times a user taps your Story photo or video to go back to the previous piece of media.
This insight reflects the number of times users send messages through the Send Message text box on your Story.
This insight reflects the number of times users swipe to skip to the next account’s Story — not to be mistaken for "tap forward," which reflects users skipping ahead to your next piece of Story media.
This insight reflects the number of times a user leaves the Stories section entirely to return to the home feed.
Now that you know how to access data to inform your strategy with Instagram Insights, you can analyze that data and determine what's working for your audience (and what's not). From there, creating content that gets a ton of engagement will be a lot easier as you consider those benchmarks.
Editor's Note: This post was originally published in January 2018 but has been updated for comprehensiveness.
Originally published Jan 12, 2022 7:00:00 AM, updated June 24 2022
Topics:
Instagram Marketing
Any successful strategy requires four components: goal-setting, implementation, analysis and refinement. Instagram analytics address the analysis portion of this equation for social marketers.
Good Instagram analytics tools help you understand how your Instagram efforts are paying off. You can learn what’s working and what’s not. Then you move onto the refinement portion of the strategy, tweaking your efforts to boost your results and improve ROI.
Let’s look at some of the best Instagram analytics app options, and the most important Instagram metrics you need to track.
Instagram analytics tools
How to see your Instagram analytics
How to access Instagram analytics on desktop
Important Instagram metrics to track
Bonus: Get a free social media analytics report template that shows you the most important metrics to track for each network.
Instagram analytics tools1. Instagram InsightsIf you’re using an Instagram Business or Creator account, you have access to this built-in Instagram analytics app.
(If you’re still using a personal account, check out our step-by-step instructions to switch over to an Instagram Business account now.)
This native analytics tool within the Instagram app provides insights into your account performance, including reach, engagement, followers, and Instagram ads. We’ll show you exactly how to see Instagram analytics using Insights later in this post.
Insights is a great Instagram analytics free tool, but it may not be the best Instagram analytics app for serious social marketers. For more robust, longer-term tracking, or to export your data for a social media report, you’ll need to look at other Instagram analytics tools.
2. Hootsuite AnalyticsHootsuite Analytics allows you to track Instagram analytics in more detail than the native Instagram Insights.
Source: Hootsuite
Sure, we may be biased, but for the record, here are some things that the Hootsuite Analytics dashboard can do that Instagram can’t:
Learn more about Hootsuite Analytics here:
3. Hootsuite ImpactIf you need an even more detailed overview of your performance, this tool is for you. Hootsuite Impact allows you to compare metrics for different social accounts side by side. It also provides detailed ROI analysis for both organic and paid Instagram activity.
Remember how we said right up at the top that refining your strategy is a key part of using analytics to improve? Hootsuite Impact can provide custom recommendations for refining your strategy based on your specific goals.
Hootsuite Impact is available for all Hootsuite Business and Enterprise plan users. Book a demo here.
This is another native Instagram business analytics tool. However, instead of being built into the mobile Instagram app, Creator Studio works on your computer.
Creator Studio gives you access to most of the same metrics as Instagram Insights, but only for a seven-day window.
Source: Creator Studio
One neat analytics feature of Creator Studio is the Calendar view, where you can see at a glance exactly when you posted to Instagram.
If you’re a member of Brand Collabs Manager, you can also track your brand collaboration metrics here in Creator Studio. We’ve got a full blog post on how to use Creator Studio that walks you through all the ways you can use it with your Instagram Business or Creator account.
5. IconosquareStart with Iconosquare’s Instagram audit for business accounts. This Instagram analytics free tool provides data on your reach, engagement, likes, saves and more. It also provides information on how your Instagram metrics stack up against the average rates on the platform.
Source: Iconosquare
Iconosquare also offers a free trial of their pro dashboard. You’ll get all the standard metrics: engagement rates, follower stats, Stories data, et cetera.
6. KeyholeKeyhole specializes in Instagram hashtag analytics and keyword tracking, along with all the usual Instagram metrics.
Source: Keyhole
It can be used to measure how branded hashtags perform, and track promotions, user-generated content and Instagram contests in real-time. It’s also a useful tool to track Instagram analytics when you work with influencers.
7. PhlanxPhlanx offers a free, easy-to-use Instagram engagement calculator. The handy thing is you can use it to check your own account, or someone else’s. That means you can use it to pre-screen potential influencers and brand ambassadors.
All you have to do is type in any Instagram handle to see total followers, engagement rate, and average likes and comments per post.
Source: Phlanx
8. Facebook Ads ManagerIf you’re running paid campaigns on Instagram, Facebook Ads Manager is a key resource in your analytics toolbox. It provides performance and cost information for all the ads you place on the Facebook family of products, including Instagram.
You can get performance information for your Instagram promotions within Instagram Insights, but to perform a thorough cost analysis, you’ll want to incorporate Ads Manager as well.
How to see your Instagram analyticsHere’s where to find all your Instagram metrics within the Instagram app. (Remember that you need a Business or Creator profile to access analytics.)
Instagram account analytics
Source: Instagram
In the top menu, you can choose whether to view these Instagram metrics for the last 7 or last 30 days.
Instagram followers analyticsFrom the overview screen, scroll down to Your Audience and click See All. You’ll see an overview of your follower growth, followed by details on your audience demographics.
You’ll find loads of useful information on this screen, including your audience’s:
In addition to tracking your follower growth metrics, this is valuable data for planning when to post on Instagram as well as guiding your content strategy.
From the overview analytics screen, scroll down to Content You Shared, then click the right arrow next to your number of posts.
This will bring up a listing of all your posts, sorted by the metric you choose. The default is reach, but you can choose from a long list of metrics, including comments, follows, shares, and more.
Bonus: Get a free social media analytics report template that shows you the most important metrics to track for each network.
Get the free template now!
You can choose timeframes from 7 days up to 2 years, and filter by post type (photos, videos, carousel posts, or all posts).
You can also find the analytics for any individual Instagram post by clicking the View Insights link under the post in your feed.
Source: Instagram
This will bring up a little pop-up box showing the total likes, comments, saves, direct message shares, profile visits and reach.
Source: Instagram
Instagram Stories analyticsFrom the overview analytics screen, scroll down to Content You Shared, then click the right arrow next to your number of Stories.
Just like for your posts, you can see reach, impressions, and so on. You can also see exits, forwards, and other Stories-specific metrics. You can view a time range from 7 to 30 days.
Source: Instagram
For more details, we’ve got a whole blog post to help you make the most of your Instagram Stories analytics.
Instagram Reels analyticsAs of May 2021, Reels analytics are included in the Reach breakdown in Instagram Insights. To access it, tap the right arrow next to Accounts Reached in the overview screen.
Here, you will see how your Instagram Reels performed compared to other content types over the last 7 or 30 days. This section also includes a ranking of your top Reels.
Source: Instagram
To view insights specific to Reels only, scroll down to Reels in the Insights overview screen and tap the right arrow next to your number of Reels. Here, you can see all of your Reels performance metrics in one place.
To check in on the performance of a specific Reel, open the Reel from your profile, then tap the three dot icon in the bottom right of the screen, then tap Insights.
Source: Instagram
For more information, check out our guide to using Reels Insights to make better content.
Instagram Live analyticsThe May 2021 Instagram update also brought Live analytics to Insights.
To access Live Insights, go to the overview analytics screen, scroll down to Live and click the right arrow next to your number of streams. Here, you will see metrics related to Live streams: accounts reached, peak concurrent viewers, comments and shares.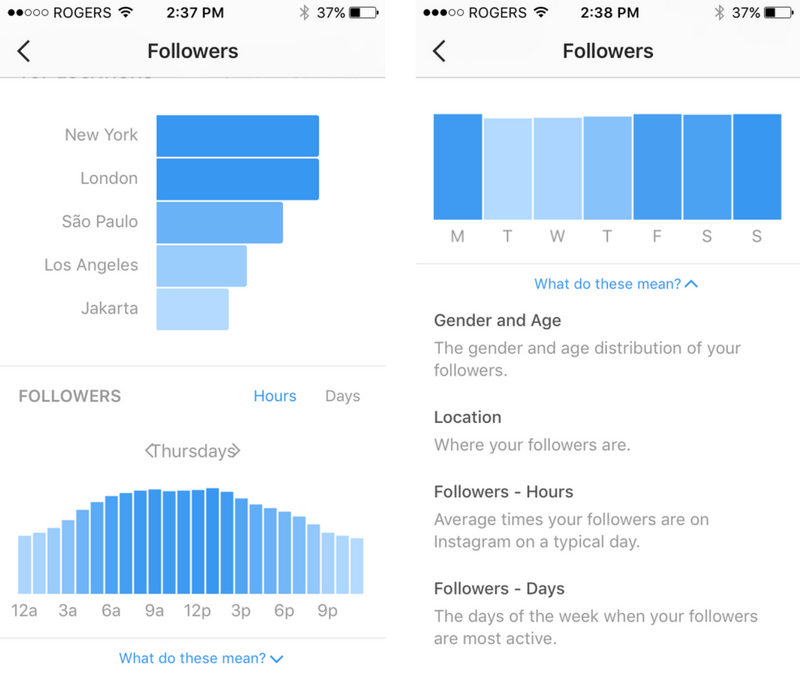
Source: Instagram
How to access Instagram analytics on desktopNavigating through analytics on your phone is great for quick, on-the-go tracking of your Instagram metrics, but it’s not the greatest when you’re trying to analyze your data or create a social media report.
Fortunately, you can also access your analytics on your computer using an Instagram tool for desktop like Hootsuite Analytics and Hootsuite Impact.
1. Go to your Hootsuite dashboard, and click the Analytics icon in the sidebar.
2. Select your Instagram Overview (if you haven’t already, follow these steps to connect your account)
Select your date range, review your metrics, and schedule any reports you need.
Important Instagram metrics to trackFeeling a little overwhelmed? With so much information available, it can be tough to figure out which data points really matter for your brand.
Here, we break down which Instagram metrics you should track to reach the goals that matter to you.
Account metricsEngagement rateHow to calculate engagement rate:
Average across all posts: [Post interactions ÷ total follower count (or impressions) ✕ 100]
This metric is a baseline for evaluating how well your content is resonating with your audience and inspiring action. Note that this percentage will often dip as you gain more followers.
Almost all analytics tools will calculate this number for your account, as well as for each post.
Because some experts think the number of impressions is a better comparison than follower count, you might get a different percentage from different calculators.
Pro tip: If you want to get granular, here’s a breakdown of all the different ways to calculate engagement rate.
Follower growth rateHow to calculate follower growth rate:
Number of followers gained ÷ previous number of followers ✕ 100
If you don’t track growth over time, your follower count is pretty much just a vanity metric. That’s a wasted opportunity, because no other Instagram metric has a bigger impact on organic reach.
(If one of your goals is increasing brand awareness, check out our tips for getting more Instagram followers.)
Website referral trafficThe number of people who visit your website from Instagram.
Monitoring the flow of traffic from Instagram to your website is key if you want to increase your Instagram ROI.
There are three main ways to measure website traffic from Instagram:
Pro tip: If tracing customer movement along the buying journey sounds great, but complicated, we recommend you take a look at Hootsuite Impact.
How to calculate post engagement rate:
Post interactions / total follower count (or impressions) ✕ 100
Engagements (likes, comments, and saves) show that you’re connecting with followers on Instagram. Some social media experts prioritize comments over likes because they take more effort and may indicate a higher level of interest.
Post comment rateHow to calculate post comment rate:
Post comments ÷ total follower count (or impressions) ✕ 100
A like is fairly easy to dish out, whereas you’ll want to pay attention to the people who take the step to leave a comment on your post.
If your goals involve building loyalty, or nurturing relationships, count comments separately from overall engagements, and work to lift that number specifically.
Pro Tip: Cross-reference comment counts against message sentiment in your social listening tool to check not just whether your content is resonating, but how.
The total number of times your post was served to Instagram users.
The number of impressions a post earns can indicate how well you’re promoting your account and content.
Are you choosing the right hashtags? Cross-promoting effectively? Have you considered promoting your posts with some ad spend?
Keep an eye on this number. Especially if your goal is building awareness at the top of the sales funnel.
ReachThe total number of unique accounts who saw your post.
Your organic reach is related to the number of followers you have, but that’s not the whole story. It’s also related to how interesting your content is.
The more engaging your content is, the more people will see it. That’s why it’s key to understand how the Instagram algorithm works.
Instagram Stories metricsStories engagementHow to calculate Stories engagement:
Total actions ÷ Total reach X 100
To measure engagement on your Stories, add up the replies, profile visits and sticker taps earned. These positive interactions can tell you what you’re doing right.
For a full rundown of Instagram Stories analytics, check out our guide.
Completion rateHow to calculate Stories completion rate:
Number of people who viewed the final Story segment ÷ Number of people who viewed the first Story segment X 100.
People watching your Story all the way through indicates your content is connecting with your fans.
It’s also a good idea to keep an eye on all the navigational metrics for potentially negative feedback:
This is great feedback for those who don’t mind a little tough love. Use this information to up your game on Instagram Stories.
Reels metricsReel engagement rateHow to calculate Reel engagement rate:
Reel interactions ÷ total follower count (or views) ✕ 100
Add up the total Reel likes, comments, shares and saves, then compare that to either your follower count or the number of viewers for the Reel.
Using your follower count in this figure will give you a sense of how compelling your Reels are for your overall audience, while using the number of viewers will give you a better idea of how Reels perform against one another.
Live metricsLive engagement rateHow to calculate Live engagement rate:
Live interactions ÷ total follower count (or accounts reached) ✕ 100
Add up the total Live comments and shares, then compare that to either your follower count or the number of accounts that Live stream reached.
Instagram Ads metricsClick-through rateHow to calculate ad click-through rate:
Clicks ÷ Impressions X 100
Click-through rate is an important metric to track, but remember that a higher rate is not always what you’re looking for. If you’re paying for each click, you want to make sure your ad copy properly qualifies potential buyers so only those who are actually interested in your brand click through.
For many brands in ecommerce and B2B, this number is the ultimate goal. You want to sell your product, sign up a new lead, or get an email address.
You can track these tangible results using Hootsuite Impact.
Cost per resultHow to calculate cost per result:
Total amount spent ÷ number of results (for a specified time period)
How much did each of those conversions cost you? Keep an eye on this number to make sure you don’t pay more for a conversion than it’s worth. You can find this data in Facebook Ads Manager.
Save time managing your Instagram presence with Hootsuite: Schedule posts and Stories ahead of time, and monitor your efforts using our comprehensive suite of social media analytics tools. Try it free today.
Get Started
Easily track Instagram analytics and generate reports with Hootsuite. Save time and get results.
Try it for Free
.
Instagram account statistics could only be viewed using third-party services and programs, but now it can be done in your own account and even from a computer to Facebook in Creator Studio. Where is this statistics and how to do it on Android and iPhone?
Instagram statistics for the account as a whole, individual publications and Stories can be viewed for free, but first you need to create a business account or an author account.
👉 How to make a business account on Instagram
You will get statistics of the photo and the whole account after switching to a business profile or author account . You can do this for free. Previously, it was necessary to link the Facebook page. But now this can not be done.
But in order to run ads directly in the application, Facebook still has to be linked. To do this, you need to remember your e-mail and password from your Facebook account, as well as create a public page for your business account.
After transferring to a business account or an author account, you will see the inscription “View professional panel” and the “Statistics” button at the top.
If you immediately click the button, then you will immediately go to the Statistics of your Instagram profile.
If you click "View professional panel" - then you can see all the tools for working with a business account / author account. Including there will be a line "all statistics".
The third way to view Instagram statistics - in your account, click the three bars on the top right and select "Statistics"
Instagram account statistics can only be viewed from the current moment. Everything that happened before, no one will ever know =) Therefore, you will see some intelligible statistics for the entire account within a week, and only new posts will have photo and video statistics.
Statistics are needed not only to track the progress of an account, but also for potential advertisers who ask for the Reach and Engagement of an account before buying an ad. What does Instagram stats mean?
On the main screen, you can select the period from the top - statistics for the last 7 days or 30 days.
Accounts Reached - is the total number of people who saw your posts, Stories and IGTV) in a week, plus a comparison with last week. It differs from Impressions in that here each person (account) is counted only once, even if he watched your posts several times. Therefore, Reach will always be less than Impressions.
👉 Instagram reach: what is it and how to increase it?
Click on Covered accounts and more detailed statistics will open.
Subscribers and everyone else (by reach) - how many of the audience covered were subscribed to you, and how many were not.
Content type - which content received the most coverage (also broken down by subscribers and unsubscribers)
Here you can also see which posts were the most popular in terms of reach. And if you press the triangle bracket 9 on the right0013 > , then you can filter statistics on Instagram by other indicators (comments, likes, subscriptions, etc.).
Impressions is the total number of content views. One person could watch several times, different content. Therefore, impressions are always more reach.
Actions in the profile are visits to your Instagram account plus clicks on the buttons in the account header (email, store, phone, etc.).
YOUR AUDIENCE
Return to the first Instagram Insights screen. In the Your Audience section, click the triangle bracket on the right > . Statistics on subscriptions and unsubscribes on Instagram will open.
Increase - on this graph you will see the number of subscribers, unsubscribers and total (subscriptions minus unsubscribes).
Below are statistics by location, age and gender.
Peak periods - time (days and hours) when followers were most often on Instagram.
CONTENT YOU POSTED
Go back to the first Instagram Statistics screen. In the "Content you've posted" section, you'll see the number of posts/Stories/IGTV/Promotions in the last 7 or 30 days (depending on the filter on the top left). For each type of content, you can filter by all engagement indicators (impressions/reach/likes (likes)/comments/saves).
This will help you better understand the results of advertising from bloggers or giveaways. But this is only available for profiles with more than 10,000 subscribers. You can wind them up and go to the author’s account, especially if you don’t have enough 1000 subscribers and can’t wait to get new statistics right now. This will not hit the account engagement much. But ideally, of course, you need to grow organically, with the help of advertising from bloggers and targeting.
To find out the statistics of views (and not only) of each publication - photo or video on Instagram, you need to open the desired post and click "Statistics".
The top line of statistics is the number of likes, comments (👉 Comments on Instagram: how to talk subscribers), transfers to Direct and saves.
Saves - how many times the "save" button was pressed.
Visits to profile - how many times they went to the account from this photo.
Reach - how many people viewed the photo. On average, there should be 30-60% of subscribers. Less - a lot of bots that do not look at posts. More — if you ran an ad, got featured, the post turned out to be very popular, shared, etc. The larger your account, the smaller the reach in % of subscribers. Old followers abandon accounts or lose interest. This is fine. The highest coverage (in % of subscribers) is for accounts with up to 1000 subscribers. To increase your reach, be sure to post regularly, with a content plan. Even according to the coverage statistics on Instagram, you can understand whether you published a post at the right time or not.
If you swipe up on these statistics on Instagram, you can find out even more interesting things about the statistics of the post.
Profile visits - how many people went to your account after seeing this post
Reach - how many people saw your post.
Impressions - how many times your post was viewed. One person can view multiple times, so impressions are always more than reach.
From main page - how many people saw the post in the feed
From "Interesting" - views from the recommended tab, with a magnifying glass. The more, the more likely that the post has become "viral" (it is sent to friends, it appeared in the recommended). Also, a large percentage happens if you promoted a post.
From profile — how many people saw the post by logging into your account
From hashtags — how many came from hashtags
From “other” - all other sources
In a personal account, you can only see the total number and accounts of those who saw your Stories. To do this, swipe up from the bottom of any Story on Instagram.
After switching to a business or author account, you will have detailed statistics for each Instagram Stories. What does each statistic mean?
INTERACTIONS
Total statistics on the number of reactions to your Stories:
Replies — how many people answered you in Direct on this Story
Clicks on the link — how many times after this Story they went to your account and clicked on the link in the description.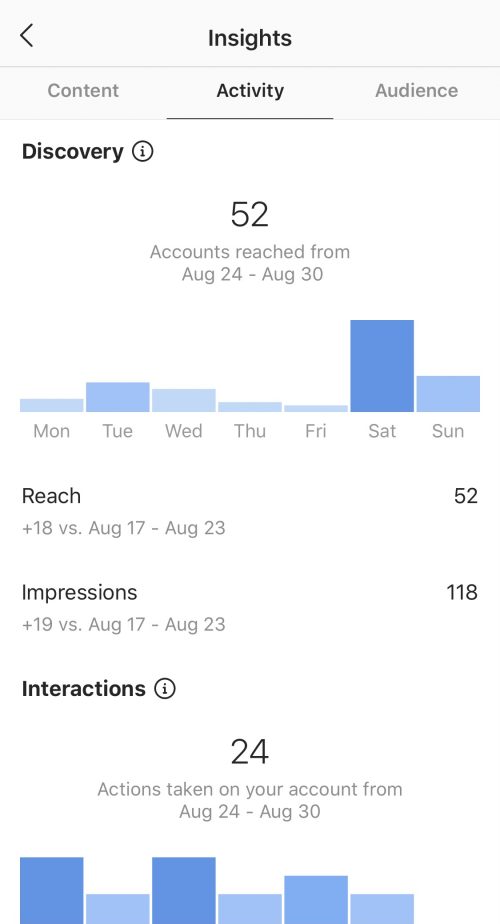
Visits to profile - how many times after this Story they went to your account.
REACH STATISTICS
Here you will see statistics on how many people see your Stories and how they find them:
Accounts covered by this Story (Reach) - total number of people who saw this Story
Impressions - how many times this Story was viewed .
Subscriptions — how many subscriptions after this Story.
Navigation = back + scroll forward + jumps to next Story + exits0003
Forward - Number of taps forward to view your next Story
Next Story - Number of scrolls to the next account's Stories. Here you can understand whether was interesting or not was History , whether a person wanted to watch your content further or moved to the next account.
Exits — number of exits from the Stories view mode. Again, you can see the statistics of how the Story was able to keep the attention of subscribers.
Do not draw conclusions after the first week, how to connect free statistics on Instagram. Check how it will change for at least a month. Compare weekdays, weekends and holidays, good/bad weather outside.
Don't be in a hurry to "give it all away" if your coverage dropped in late spring and summer. Previously, no one had such statistics, and people who do not know the general trends in social networks and the Internet are afraid of fluctuations in statistics in their Instagram account. In the fall and after the New Year holidays, there is always an increase, and in the spring and summer there is an outflow. Of course, this does not apply to "seasonal" businesses (spring-summer travel agencies have growth, for example).
Even though many of us have a smartphone as an extension of our hand, we still scroll through Instagram less when we are on vacation, it’s summer outside, etc. Therefore, do not rush to arrange another giveaway or pour extra money on advertising if your coverage decline is seasonal. But do not abandon your account, if necessary, make pending posts for the holidays. Then even if you yourself are resting, you will still flicker in the feed of subscribers.
You will have the most reliable statistics a year after you make it. Therefore, it is best if you monitor your indicators on Instagram and write them down separately, noting what you did - cheating, advertising with bloggers, advertising (targeting), other promotion methods.
How did followers come across your account? What posts do they most often save, which ones do they forward to friends, after which ones do they most often decide to call or write? What cities do they live in? How old are they? What days of the week and what time of day are they most active on Instagram?
Statistics Instagram allows you to find out this most valuable information and, thanks to it, work more accurately with your audience and increase sales.
To access statistics, you need to switch your account to a business profile. Click on the menu (horizontal bars) in the upper right corner, select from the list "Settings" , then "Account" and "Switch to a professional account" .
More on this: "How to create a business account on Instagram."
Statistics will be collected from the moment you switched.
Now under each post we have a sentence "View statistics" . By clicking on it, we see several numbers.
We had information about the number of likes and comments before. But now we also have "airplane" - the number below it shows how many times your publication was sent to direct to other people. And also "flag" - it signals how many times your post has been saved.
"Profile visits - 9» . What do these words and numbers mean? The fact that 9 people who viewed the publication wanted to go to your profile.
Is it good or bad?
It may be different. This could mean that your subscriber thought:
“Wow, what a great post. I really wanted to buy from them. I’ll go see what kind of company this is, maybe I’ll ask them a couple of questions about the product.”
Or vice versa:
“Who wrote such nonsense? When did I manage to subscribe to this? What for? I’ll go look at their profile, maybe I’ll remember why I signed up, if this is not something promising in the future, I’ll unsubscribe as soon as possible.
It shows how many people actually saw your post. For some, this figure may be shocking. Did you think that you have 10 thousand subscribers, and statistics show that each of your posts is seen by no more than 1 thousand people? Yes, it happens, and very often. Coverage from 30% to 60% is a good indicator for commercial accounts, 10% -15% is very common.
By swiping up on (i.e. tapping the stats with your finger and swiping up the screen), we see more stats.
"Subscriptions - 2". This entry indicates that two people who saw your post decided to follow your account. That is, they were not subscribers before. How do you know how they came across your post? The answer may be further.
"Scope - 1026" . The post was seen by 1026 people, we have already talked about this. Curiously, more than half of these people (52%) were not our subscribers. How did they see our post? We will also look for the answer to this question in the following data.
Impressions - 1597 . This entry means that the post was shown 1597 times. And Reach showed that our post was seen by 1,021 people – a lot less.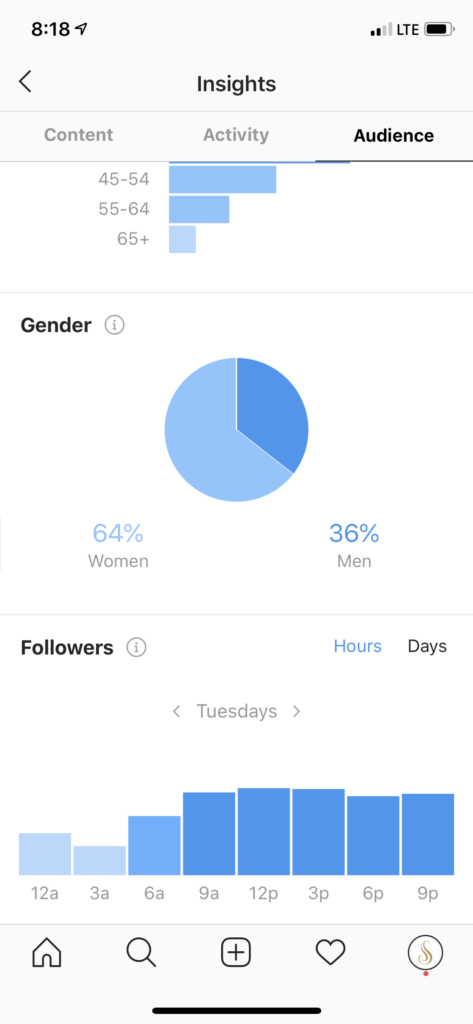 How can this be? Very simple. The number of impressions is almost always greater than the reach, which means that part of the subscribers saw your post two or more times.
"From the Main - 770" . That is, 770 people saw your post just in their feed. These are your followers.
"From hashtags - 582" . 582 people came across this post thanks to hashtags. Here is a possible answer to the question of how 52% of people who were not our subscribers found our post, and where these two new subscribers came from. All of them came to you by hashtag, and two of them became interested in the account and stayed. Unfortunately, this cannot be said for sure, we can only guess by comparing the data on hashtags, subscriptions and the number of people reached who were not subscribed to you before.
"From profile - 7" . These seven first came to the main page of your account, and from there they already went to the post. In what cases does this happen? For example, another Instagram account linked to you, people came to your main page, and from there they went to the post. Either the link to Instagram was on your website, or customers saw the name of your account in the office. There may be many options. The main thing is that people first went to the profile, and then they came to this particular publication.
"From Another - 240" . This line tells you the number of people who came to your post from other sources. For example, someone sent them a link to this post in Direct or shared it in another way (in an email, via messengers, on a website), or your post was saved, and then they looked at it again, and this re-view was counted in the line " From the Other."
This way we can see the statistics of any post that was published after switching to a business profile.
We also have the opportunity to find out the statistics of the account as a whole.
To see the account statistics, we again need to go to the menu (horizontal bars in the upper right corner) and click on the line "Statistics" .
Here we see tabs "Content" , "Actions" and "Audience" .
In this tab, by default, we are shown our posts and stories sorted by reach. First, the most popular - that is, those who received the largest coverage, and then in descending order.
We are also told how many posts and stories we had in total in the last week (45) and how this compares to the previous week (5 more).
We can sort both posts and stories by different parameters and for different periods. By clicking on the button " All ", we get the opportunity to select posts with the most likes - for this we need to select the line with the word "Like marks" . Or the one with the most comments. Or separate those posts, after viewing which readers started calling you - for this you need to select "Calls" . Or the ones that reposted the most.
You can also see the most successful posts by the sum of all these indicators - likes, comments, calls. To do this, select the first line - "Involvement" .
We can also make a selection for different periods - a maximum of 2 years, a minimum of 7 days. And see separately the comparative indicators of photo posts, video posts, carousels.
The same with stories. We can sort them by ostentatious indicators - "reach", "clicks to the site", "calls" and others, and also make a selection for different periods, but the maximum possible period in the case of stories is 14 days.
In this tab, you can see how reach, impressions, and other important indicators have varied over the past week - the number of visits to the profile, clicks on the site, clicks on the "Getting Directed" button.
Explore shows our total reach and impressions for the last week.
We see that the coverage was 3854 people, and it is very much reduced compared to the previous week.
Total impressions - 17698 people, and also a noticeable decrease compared to the previous period.
Also on the graph, we can see which days the coverage was more or less.
And by pointing a finger at this graph, we see specific figures - one and a half thousand coverage on Monday and Wednesday, almost the same on Tuesday, on other days much less.
In the "Interaction" block, you can see how many visits to the profile, clicks on the site from the profile, clicks on the button "How to get there".
We are also shown a graph of the distribution of this activity during the week. We see that the most actions were on Wednesday - 57 pieces.
To see specific figures, touch this graph with your finger.
In this tab, we can see how the number of your subscribers has changed over the past week, in which cities and countries your subscribers live, how old they are, what time they are most active.
This tab gives us information about the number of subscribers. In particular, about how many people have unsubscribed from us, how many have subscribed, and what the result is an increase - it can be positive and negative, when after all the subscriptions-unsubscribes, the number of subscribers has decreased.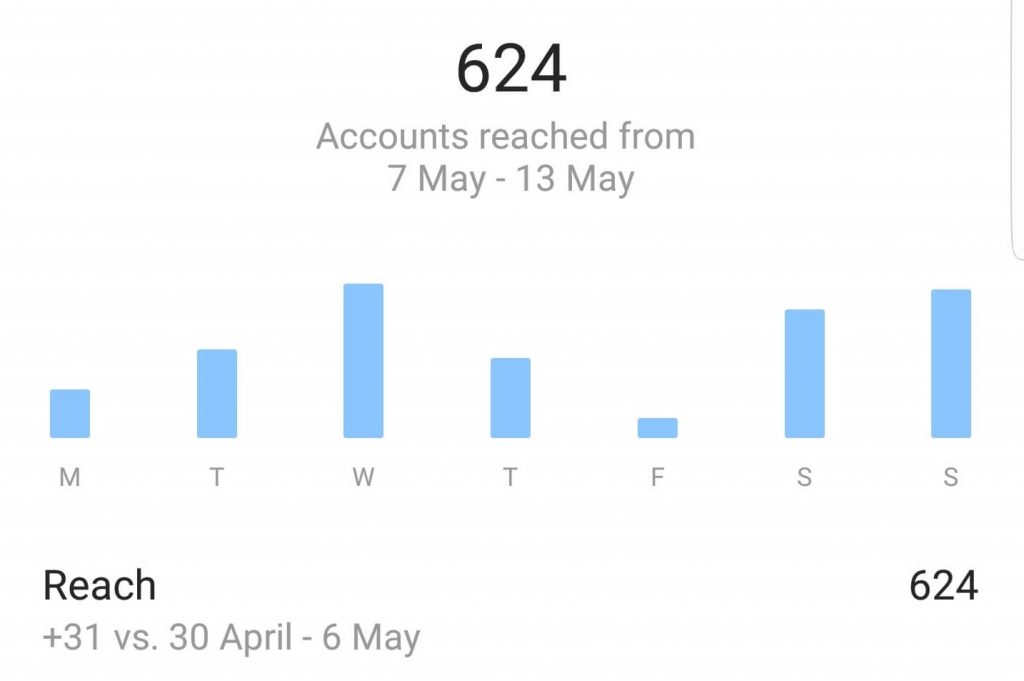
In our example, 12 unsubscribed, 16 subscribed, the end result is plus 4 subscribers this week.
Below we see a graph of the number of subscribers. We see a failure on Saturday. We can press our finger on this failure, and we will be shown more detailed information about it. We see that on Saturday, December 7, three people unsubscribed from us and no one signed up.
And if we want to find out what kind of publications led to such a result, we can click on the button "View publications" and we will see just posts and stories for December 7-8 and statistics on them. In this way, you can understand which publications readers do not like. Although in our case the numbers are too small to speak of conclusions. Rather, they are within the bounds of statistical error.
Below we can see information about the cities in which our subscribers live.
As expected, the Moscow children's center, whose account we are considering, has the majority of subscribers from Moscow.
And by clicking on the button "Countries" , we will find out from which countries in what proportion we have subscribers. Also, most are expected from Russia, but there are also from Kazakhstan, the USA, Ukraine and even Brazil.
In the next section, we can see what age men and women are in our account.
We see that our subscribers are dominated by people aged 25 to 34 years, slightly less women and older men - from 35 to 44 years old.
Interestingly, our account is also followed by schoolchildren under the age of 17 and older people over 65. Where Instagram has gone!
Here we are shown that 71% of our subscribers are women, only 29% are men.
This section is called “Followers” for some reason, although it would be more correct to call it “Followers Activity”, because that is what it shows: at what time of the day and what days of the week your followers are most active on Instagram.