Being a business on social media can be a minefield. Having as much data to hand about your business profile, the audience you’ve amassed and the posts that gain you the most traction can help navigate this ever-evolving terrain. Accessing more analytical data for your social media profiles could help you develop an engaged audience, gain more customers and grow your business online. This is why having as much information to hand as possible is invaluable.
When it comes to historical data, this can help you hit the ground running. If you have data relating to your social media posts and profile available to you as soon as you choose to seek out insights, you'll have information ready to interpret and enhance your social media presence immediately. Instagram insights are only available in-app or via a third-party tool if you have a business or a creator account.
Today we’ll be looking at historical Instagram analytics, the data available within the in-app insights and the data available when you connect your Instagram profile to the analytical tool Minter. io.
On Instagram, insights are only available for content you’ve posted since converting your account to a professional account (business or creator). You can change your account type following this guide. Insights through Instagram are only available on the mobile app.
You can connect your Instagram account to Minter.io to get more in-depth insights over a longer time frame. Your Instagram account must be a professional account to do this.
Audience demographics are the key for making engaging content which your audience will love. Without having information on gender, location, language etc. it can be difficult to share content that is relevant to the people who follow you on Instagram.
You can only view audience demographic data if you have over 100 followers. The audience demographic data always shows information about all your followers.
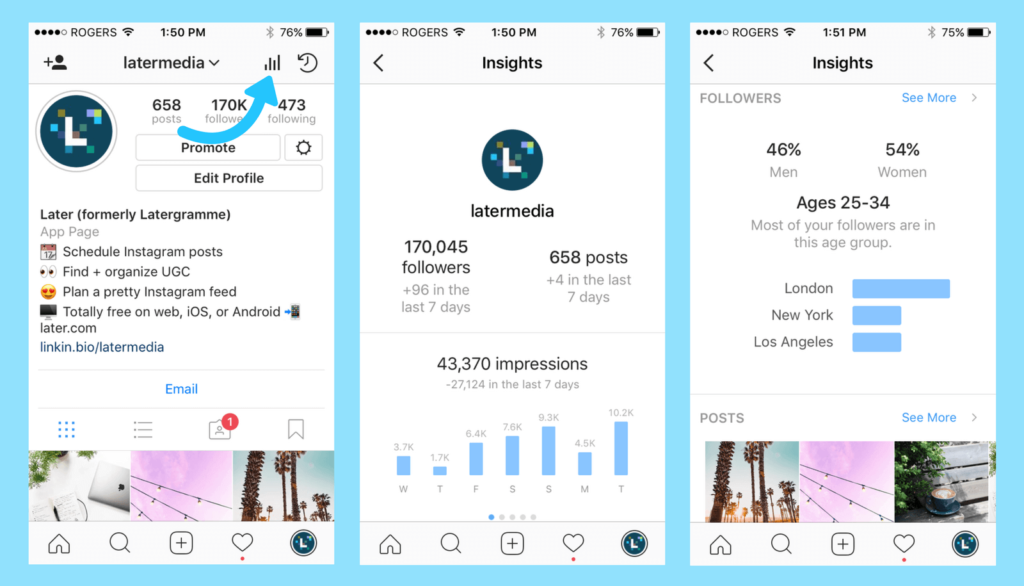
Audience demographic data available via the in-app insights by Instagram including top locations, age range, gender and most active times io
io
Historical information on followers and follower change graphs is available for up to 30 days, or since the Instagram profile was converted to a business or creator profile, for most profiles regardless of follower size. There may be longer backdated data available for some larger Instagram profiles.
Once your Instagram profile is connected to Minter.io, the information is viewable for longer than 90 days. You can view your total audience demographics by selecting ‘All Time’ with the date picker or select specific historical date ranges - something that is not possible through the Instagram app.
Data about your profile gives you a better overview of how many people are seeing your profile and the actions they are taking on it.
Profile data is only accessible for up to the last 90 days. After 90 days, the profile analytical data for your profile is no longer available to you through in-app insights. This includes: accounts reached, content interactions overview and followers.
Using the date picker you can choose to view insights from the last 7, 14, 30 or 90 days, the previous month, or a specific date range within the past 90 day period. Interestingly, although profile insights are capped by a 90 day window, Instagram insights still compare some metrics with the relative previous date range by percentage, such as content interactions.
All profile historical data is available for up to two years, or since your account was converted to a business account. Once your profile is connected to Minter.io, the data collected afterwards is available for as long as you stay connected, so you can track your progress over a significant time frame and get a better picture for metric trends in the long term. Use the date picker to choose the time frame that suits you and organise information by your choice of day, week or month.
Dive into data about posts to find the content that gains the most traction with your following.
No historical information is available prior to converting to a business or creator account. As soon as you create a professional account, insights going forward are available to you. Information about posts are available to view for up to 2 years. This includes feed posts, stories, IGTV videos and reels.
Within your insights data, when you select a specific type of content (posts, stories, reels and IGTV) you can organise those posts by metric and date range. The date range options are currently: last 7 days, last 30 days, last 3 months, last 6 months, last year and last 2 years. There is no date picker when looking at specific types of content shared.
As soon as you connect your Instagram account to Minter.io, all posts are available except archived posts. You can access historical data for likes and comments on all your past media. You can access historical reach, impressions, saves and video views data for up to two years, or for posts published since the Instagram profile was converted to a business or creator profile.
You can access up to two years of historical data for boosted posts and separately created Instagram ads (“dark posts”). You can also access optimization historical data, which is available for all posts except archived posts. This feature lets you see the best times to posts, the post types your audience is engaging with the most and the hashtags and filters that have been most effective for you.
Although only available to view for 24 hours by your audience (unless added to a highlight), this popular Instagram feature adds another dynamic to a business profile.
With a professional account you can view stories insights for up to 2 years. After this time frame the data is no longer available to you.
No historical data is available, however once your Instagram account is connected to Minter.io, all the data captured is kept so you can look beyond the 2 year constraints held by Instagram.
There are more analytics available with Minter.io which you can’t currently get through Instagram insights. These even include historical data, to help you hit the ground running. Get up to one month of historical data for tags on Instagram posts and up to 3000 historical top posts for Instagram hashtags.
Minter.io aims to give you as much information as possible to help your business grow successfully on social media. It includes data on your profile, audience demographics and content, as well as benchmark data and specific hashtags you choose to track. You can also look at audience, posts, optimization and benchmark data for competitor accounts.
Find out how you can grow your business on social media with Minter.io. With in-depth insights for your presence online, we aim to help your business go down in history.
Klaudia Żyłka
0 0
scroll down
If you are an Instagram user and if you treat your Instagram presence seriously, most probably you’d like to know if you’re successful in what you do and how your audience reacts to the content you publish.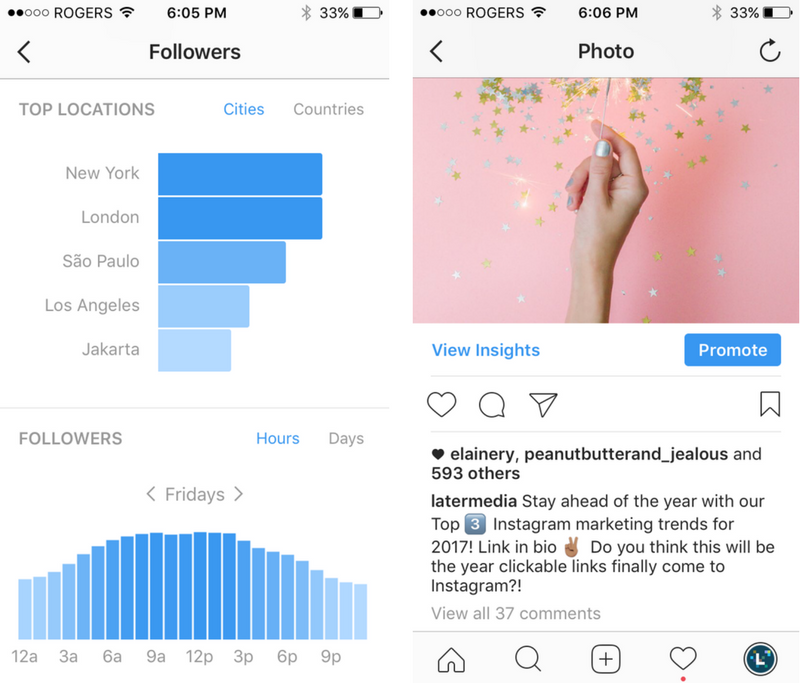 That’s why your Instagram data is worth its weight in gold.
However, as you probably know, Instagram itself isn’t making it easy for us to track our performance.
Instagram Insights – a free tool to check your Instagram dataI guess you know Instagram Insights quite well, and most probably you are also aware of the fact that the data presented there is quite limited. The biggest obstacle is, though, not the type of data but the time frame for which you can analyze your data – it is only the last 90 days.
How can one analyze their performance in a longer time period? How can you know if you are actually improving? If you are engaging your audience less or more than in the past months? Unless you manually write down data regularly once a month, you simply won’t know.
There is now also an option to see your Instagram data from Facebook’s Creator Studio. There are some pros and cons of using this free solution. Firstly, just as Instagram Insights, it is free. It enables you also to access your data from a desktop device, which may be important for some users. However, for now, in Creator Studio you can analyze data only for the last 7 days. Not enough, right?
Even though the native Instagram solutions can help only to some extent, there are other tools that can provide you with your historical Instagram data for much longer time periods. What we are talking here about are obviously external social media analytical apps.
One of such tools is Sotrender and here’s how it works there.
Once you connect your profile to Sotrender you’ll automatically get 30 days of historical Instagram data.* From this point on, you can already analyze your performance for the last month. Good enough for a start, right?
*The only exception is data about the increase in the number of followers and followers’ demographics – this is because of the Instagram API limitation, which does not return such data.
From the moment you connect your profile to the Sotrender app, we will be collecting your data regularly. That means you can analyze all your data from the moment you started using Sotrender.
For example, if you connected your Instagram profile on January 1st, you can analyze your data and performance from the beginning of the year in the middle of August.
What kind of data can you analyze then? Well, among many:
Number of followers, Sotrender
Growth rate, Sotrender
Reach, Sotrender
Profile views and profile clicks in Sotrender
To build an engaged and loyal fan base, we should be encouraging users to interact with our content in a meaningful way. Analyzing how users are interacting with our content now is crucial to understand if the level of engagement is satisfying for us. Usually, we should be aiming at getting more comments, shares or saves, than just likes.
User activities, Sotrender
If you’re not that experienced marketer or Instagram content creator yet, you may wonder what is the benefit of having such Instagram data at hand and how you can use it.
Also, if you’d like to become an Instagram influencer (we actually have a guide that may help you become one), brands that would like to cooperate with you will be asking you to share Instagram data about your performance. That’s why it’s important to have such data for longer time periods, to prove that you’re consistent and that your numbers (like engagement or followers) are growing and that cooperating with you has potential. Also, keep in mind that Instagram may soon hide the number of likes our posts get, so brands will have less public data available to analyze your performance.
Did you like the article? Share it with friends.
Share Tweet ShareKlaudia Żyłka
Marketing Team Lead
Instagram, dogs, books and food lover. Former student at Warsaw University and Malmö University. Improving her marketing skills every day.
go up
This website uses cookies to improve your experience. We'll assume you're ok with this, but you can opt-out if you wish.Accept Read More
.
Instagram account statistics could only be viewed using third-party services and programs, but now it can be done in your own account and even from a computer to Facebook in Creator Studio. Where is this statistics and how to do it on Android and iPhone?
Instagram statistics for the account as a whole, individual publications and Stories can be viewed for free, but first you need to create a business account or an author account. nine0003
👉 How to make a business account on Instagram
You will get statistics of the photo and the whole account after switching to a business profile or author account . You can do this for free. Previously, it was necessary to link the Facebook page. But now this can not be done.
But in order to run ads directly in the application, Facebook still has to be linked. To do this, you need to remember your e-mail and password from your Facebook account, as well as create a public page for your business account. nine0003
After transferring to a business account or an author account, you will see the inscription “View professional panel” and the “Statistics” button at the top.
If you immediately click the button, then you will immediately go to the Statistics of your Instagram profile.
If you click "View professional panel" - then you can see all the tools for working with a business account / author account. Including there will be a line "all statistics". nine0003
The third way to view Instagram statistics - in your account, click the three bars on the top right and select "Statistics"
Instagram account statistics can only be viewed from the current moment.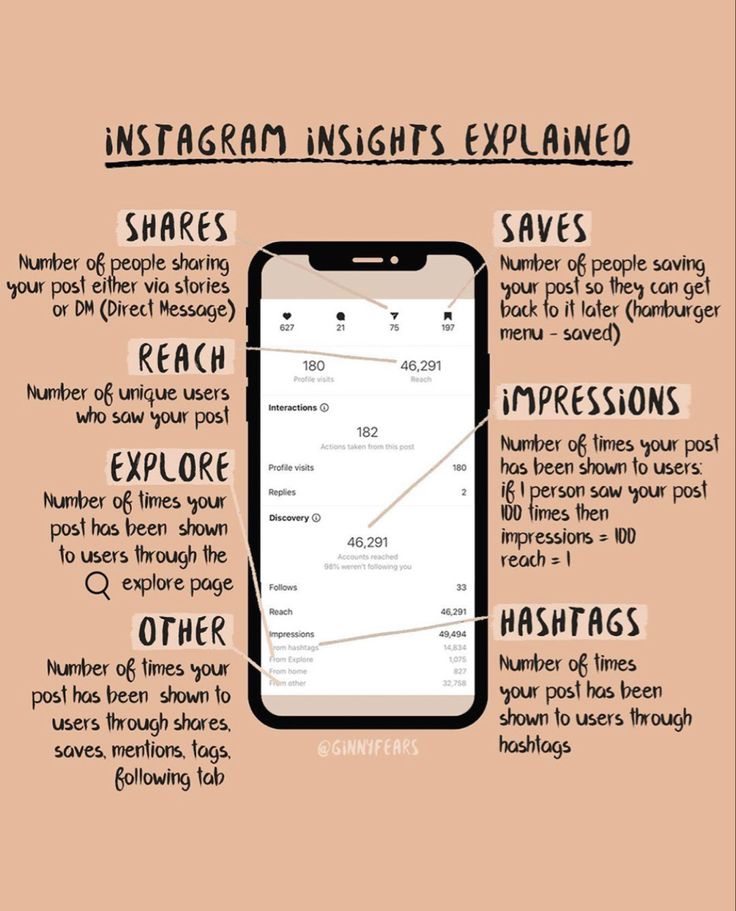 Everything that happened before, no one will ever know =) Therefore, you will see some intelligible statistics for the entire account within a week, and only new posts will have photo and video statistics.
Statistics are needed not only to track the progress of an account, but also for potential advertisers who ask for the Reach and Engagement of an account before buying an ad. What does Instagram stats mean?
On the main screen, you can select the period from the top - statistics for the last 7 days or 30 days.
Accounts Reached - is the total number of people who saw your posts, Stories and IGTV) in a week, plus a comparison with last week. It differs from Impressions in that here each person (account) is counted only once, even if he watched your posts several times. Therefore, Reach will always be less than Impressions. nine0003
👉 Instagram reach: what is it and how to increase it?
Click on Covered accounts and more detailed statistics will open.
Subscribers and everyone else (by reach) - how many of the audience covered were subscribed to you, and how many were not.
Content type - which content received the most coverage (also broken down by subscribers and unsubscribers)
Here you can also see which posts were the most popular in terms of reach. And if you press the triangle bracket 9 on the right0013 > , then you can filter statistics on Instagram by other indicators (comments, likes, subscriptions, etc.).
Impressions is the total number of content views. One person could watch several times, different content. Therefore, impressions are always more reach.
Actions in the profile are visits to your Instagram account plus clicks on the buttons in the account header (email, store, phone, etc.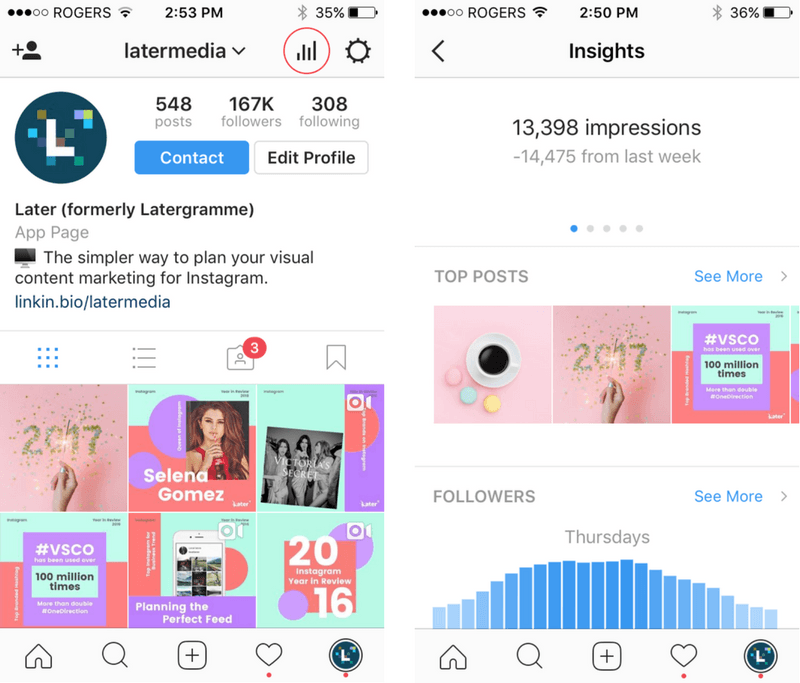 ).
).
YOUR AUDIENCE
Return to the first Instagram Insights screen. In the Your Audience section, click the triangle bracket on the right > . Statistics on subscriptions and unsubscribes on Instagram will open.
Increase - on this graph you will see the number of subscribers, unsubscribers and total (subscriptions minus unsubscribes).
Below are statistics by location, age and gender.
Peak periods - time (days and hours) when followers were most often on Instagram.
CONTENT YOU POSTED
Go back to the first Instagram Statistics screen. In the "Content you've posted" section, you'll see the number of posts/Stories/IGTV/Promotions in the last 7 or 30 days (depending on the filter on the top left). For each type of content, you can filter by all engagement indicators (impressions/reach/likes (likes)/comments/saves).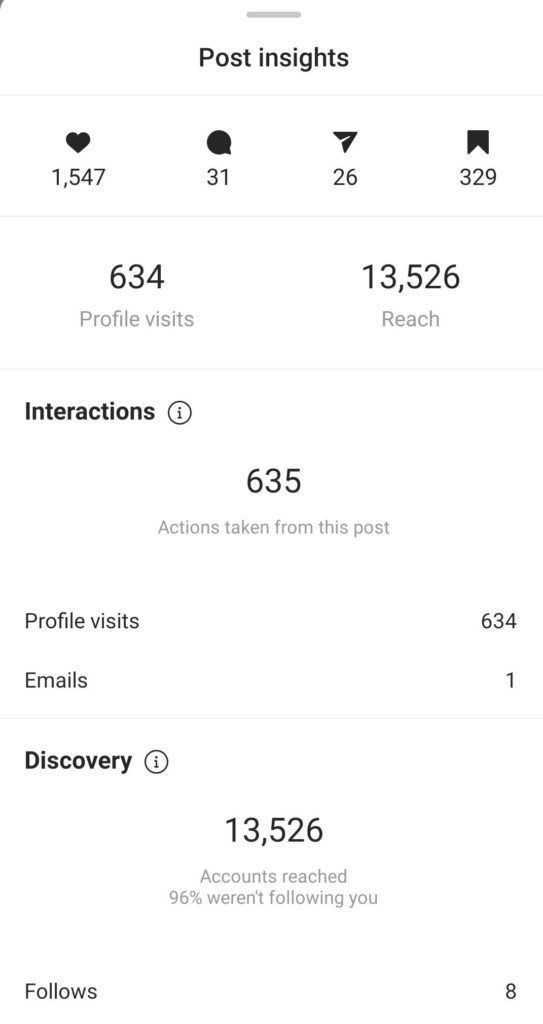 nine0003
This will help you better understand the results of advertising from bloggers or giveaways. But this is only available for profiles with more than 10,000 subscribers. You can wind them up and go to the author’s account, especially if you don’t have enough 1000 subscribers and can’t wait to get new statistics right now. This will not hit the account engagement much. But ideally, of course, you need to grow organically, with the help of advertising from bloggers and targeting.
To find out the statistics of views (and not only) of each publication - photo or video on Instagram, you need to open the desired post and click "Statistics".
The top line of statistics is the number of likes, comments (👉 Comments on Instagram: how to talk subscribers), transfers to Direct and saves.
Saves - how many times the "save" button was pressed.
Visits to profile - how many times they went to the account from this photo.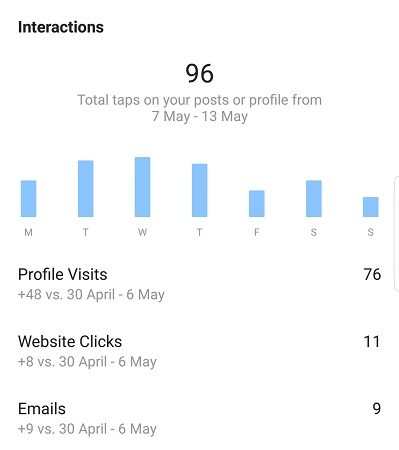 nine0003
Reach - how many people viewed the photo. On average, there should be 30-60% of subscribers. Less - a lot of bots that do not look at posts. More — if you ran an ad, got featured, the post turned out to be very popular, shared, etc. The larger your account, the smaller the reach in % of subscribers. Old followers abandon accounts or lose interest. This is fine. The highest coverage (in % of subscribers) is for accounts with up to 1000 subscribers. To increase your reach, be sure to post regularly, with a content plan. Even according to the coverage statistics on Instagram, you can understand whether you published a post at the right time or not. nine0003
If you swipe up on these statistics on Instagram, you can find out even more interesting things about the statistics of the post.
Profile visits - how many people went to your account after seeing this post
Reach - how many people saw your post.
Impressions - how many times your post was viewed. One person can view multiple times, so impressions are always more than reach.
From main page - how many people saw the post in the feed
From "Interesting" - views from the recommended tab, with a magnifying glass. The more, the more likely that the post has become "viral" (it is sent to friends, it appeared in the recommended). Also, a large percentage happens if you promoted a post.
From profile — how many people saw the post by logging into your account
From hashtags — how many came from hashtags
From “other” - all other sources
In a personal account, you can only see the total number and accounts of those who saw your Stories. To do this, swipe up from the bottom of any Story on Instagram.
After switching to a business or author account, you will have detailed statistics for each Instagram Stories. What does each statistic mean?
INTERACTIONS
Total statistics on the number of reactions to your Stories:
Replies — how many people answered you in Direct on this Story
Clicks on the link — how many times after this Story they went to your account and clicked on the link in the description.
Visits to profile - how many times after this Story they went to your account.
REACH STATISTICS
Here you will see statistics on how many people see your Stories and how they find them:
Accounts covered by this Story (Reach) - total number of people who saw this Story
Impressions - how many times this Story was viewed .
Subscriptions — how many subscriptions after this Story.
Navigation = back + scroll forward + jumps to next Story + exits0003
Forward - Number of taps forward to view your next Story
Next Story - Number of scrolls to the next account's Stories. Here you can understand whether was interesting or not was History , whether a person wanted to watch your content further or moved to the next account.
Exits — number of exits from the Stories view mode. Again, you can see the statistics of how the Story was able to keep the attention of subscribers. nine0003
Do not draw conclusions after the first week, how to connect free statistics on Instagram. Check how it will change for at least a month. Compare weekdays, weekends and holidays, good/bad weather outside.
Don't be in a hurry to "give it all away" if your coverage dropped in late spring and summer. Previously, no one had such statistics, and people who do not know the general trends in social networks and the Internet are afraid of fluctuations in statistics in their Instagram account. In the fall and after the New Year holidays, there is always an increase, and in the spring and summer there is an outflow. Of course, this does not apply to "seasonal" businesses (spring-summer travel agencies have growth, for example). nine0003
Even though many of us have a smartphone as an extension of our hand, we still scroll through Instagram less when we are on vacation, it’s summer outside, etc. Therefore, do not rush to arrange another giveaway or pour extra money on advertising if your coverage decline is seasonal. But do not abandon your account, if necessary, make pending posts for the holidays. Then even if you yourself are resting, you will still flicker in the feed of subscribers.
You will have the most reliable statistics a year after you make it. Therefore, it is best if you monitor your indicators on Instagram and write them down separately, noting what you did - cheating, advertising with bloggers, advertising (targeting), other promotion methods. nine0003
How did followers come across your account? What posts do they most often save, which ones do they forward to friends, after which ones do they most often decide to call or write? What cities do they live in? How old are they? What days of the week and what time of day are they most active on Instagram?
Statistics Instagram allows you to find out this most valuable information and, thanks to it, work more accurately with your audience and increase sales. nine0003
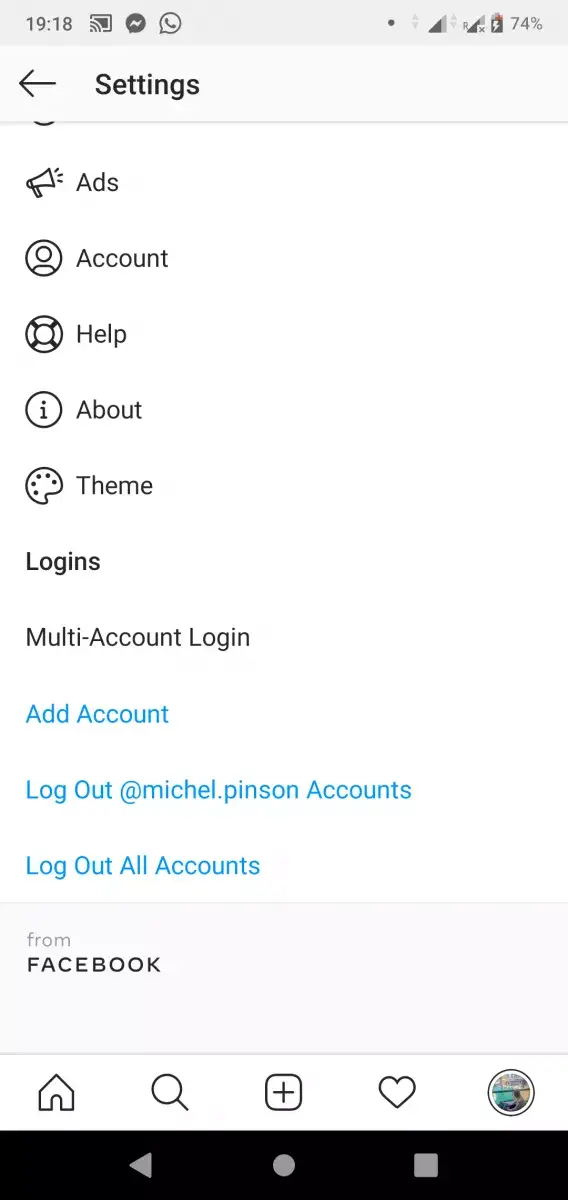
To access statistics, you need to switch your account to a business profile. Click on the menu (horizontal bars) in the upper right corner, select from the list "Settings" , then "Account" and "Switch to a professional account" .
More on this: "How to create a business account on Instagram."
Statistics will be collected from the moment you switched. nine0003
Now under each post we have a sentence "View statistics" . By clicking on it, we see several numbers.
We had information about the number of likes and comments before. But now we also have "airplane" - the number below it shows how many times your publication was sent to direct to other people. And also "flag" - it signals how many times your post has been saved.
"Profile visits - 9» . What do these words and numbers mean? The fact that 9 people who viewed the publication wanted to go to your profile.
Is it good or bad?
It may be different. This could mean that your subscriber thought:
“Wow, what a great post. I really wanted to buy from them. I’ll go see what kind of company this is, maybe I’ll ask them a couple of questions about the product.”
Or vice versa:
“Who wrote such nonsense? When did I manage to subscribe to this? What for? I’ll go look at their profile, maybe I’ll remember why I signed up, if this is not something promising in the future, I’ll unsubscribe as soon as possible. nine0003
It shows how many people actually saw your post. For some, this figure may be shocking. Did you think that you have 10 thousand subscribers, and statistics show that each of your posts is seen by no more than 1 thousand people? Yes, it happens, and very often. Coverage from 30% to 60% is a good indicator for commercial accounts, 10% -15% is very common. nine0003
By swiping up on (i.e. tapping the stats with your finger and swiping up the screen), we see more stats.
"Subscriptions - 2". This entry indicates that two people who saw your post decided to follow your account. That is, they were not subscribers before. How do you know how they came across your post? The answer may be further. nine0003
"Scope - 1026" . The post was seen by 1026 people, we have already talked about this. Curiously, more than half of these people (52%) were not our subscribers. How did they see our post? We will also look for the answer to this question in the following data.
Impressions - 1597 . This entry means that the post was shown 1597 times. And Reach showed that our post was seen by 1,021 people – a lot less. How can this be? Very simple. The number of impressions is almost always greater than the reach, which means that part of the subscribers saw your post two or more times. nine0003
"From the Main - 770" . That is, 770 people saw your post just in their feed. These are your followers.
"From hashtags - 582" . 582 people came across this post thanks to hashtags. Here is a possible answer to the question of how 52% of people who were not our subscribers found our post, and where these two new subscribers came from. All of them came to you by hashtag, and two of them became interested in the account and stayed. Unfortunately, this cannot be said for sure, we can only guess by comparing the data on hashtags, subscriptions and the number of people reached who were not subscribed to you before. nine0003
"From profile - 7" . These seven first came to the main page of your account, and from there they already went to the post. In what cases does this happen? For example, another Instagram account linked to you, people came to your main page, and from there they went to the post. Either the link to Instagram was on your website, or customers saw the name of your account in the office. There may be many options. The main thing is that people first went to the profile, and then they came to this particular publication.
"From Another - 240" . This line tells you the number of people who came to your post from other sources. For example, someone sent them a link to this post in Direct or shared it in another way (in an email, via messengers, on a website), or your post was saved, and then they looked at it again, and this re-view was counted in the line " From the Other."
This way we can see the statistics of any post that was published after switching to a business profile. nine0003
We also have the opportunity to find out the statistics of the account as a whole.
To see the account statistics, we again need to go to the menu (horizontal bars in the upper right corner) and click on the line "Statistics" .
Here we see tabs "Content" , "Actions" and "Audience" .
In this tab, by default, we are shown our posts and stories sorted by reach. First, the most popular - that is, those who received the largest coverage, and then in descending order. nine0003
We are also told how many posts and stories we had in total in the last week (45) and how this compares to the previous week (5 more).
We can sort both posts and stories by different parameters and for different periods. By clicking on the button " All ", we get the opportunity to select posts with the most likes - for this we need to select the line with the word "Like marks" . Or the one with the most comments. Or separate those posts, after viewing which readers started calling you - for this you need to select "Calls" . Or the ones that reposted the most.
You can also see the most successful posts by the sum of all these indicators - likes, comments, calls.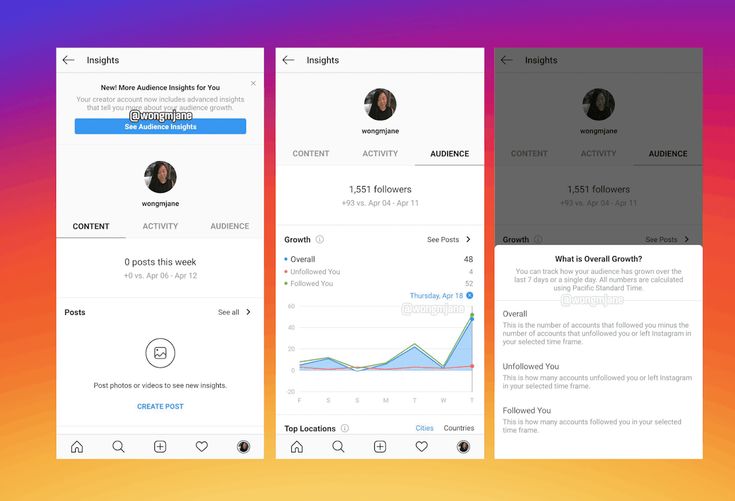 To do this, select the first line - "Involvement" .
We can also make a selection for different periods - a maximum of 2 years, a minimum of 7 days. And see separately the comparative indicators of photo posts, video posts, carousels.
The same with stories. We can sort them by ostentatious indicators - "reach", "clicks to the site", "calls" and others, and also make a selection for different periods, but the maximum possible period in the case of stories is 14 days. nine0003
In this tab, you can see how reach, impressions, and other important indicators have varied over the past week - the number of visits to the profile, clicks on the site, clicks on the "Getting Directed" button.
Explore shows our total reach and impressions for the last week.
We see that the coverage was 3854 people, and it is very much reduced compared to the previous week. nine0003
Total impressions - 17698 people, and also a noticeable decrease compared to the previous period.
Also on the graph, we can see which days the coverage was more or less.
And by pointing a finger at this graph, we see specific figures - one and a half thousand coverage on Monday and Wednesday, almost the same on Tuesday, on other days much less.
In the "Interaction" block, you can see how many visits to the profile, clicks on the site from the profile, clicks on the button "How to get there". nine0003
We are also shown a graph of the distribution of this activity during the week. We see that the most actions were on Wednesday - 57 pieces.
To see specific figures, touch this graph with your finger.
In this tab, we can see how the number of your subscribers has changed over the past week, in which cities and countries your subscribers live, how old they are, what time they are most active.
This tab gives us information about the number of subscribers. In particular, about how many people have unsubscribed from us, how many have subscribed, and what the result is an increase - it can be positive and negative, when after all the subscriptions-unsubscribes, the number of subscribers has decreased.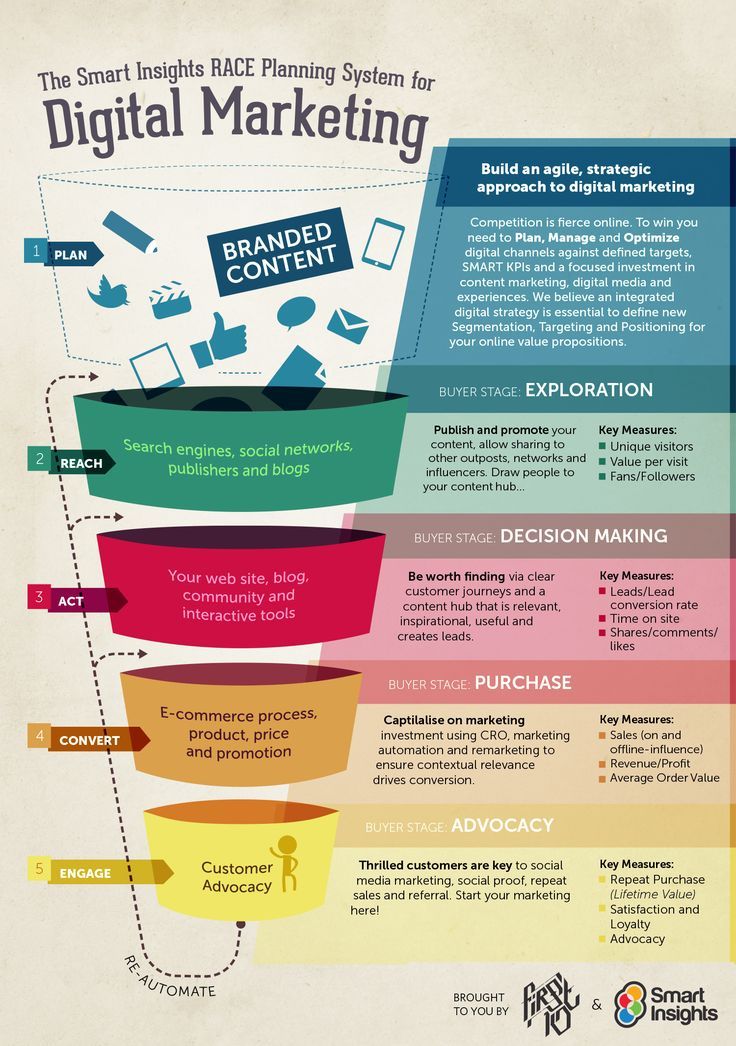
In our example, 12 unsubscribed, 16 subscribed, the end result is plus 4 subscribers this week.
Below we see a graph of the number of subscribers. We see a failure on Saturday. We can press our finger on this failure, and we will be shown more detailed information about it. We see that on Saturday, December 7, three people unsubscribed from us and no one signed up. nine0003
And if we want to find out what kind of publications led to such a result, we can click on the button "View publications" and we will see just posts and stories for December 7-8 and statistics on them. In this way, you can understand which publications readers do not like. Although in our case the numbers are too small to speak of conclusions. Rather, they are within the bounds of statistical error.
Below we can see information about the cities in which our subscribers live. nine0003
As expected, the Moscow children's center, whose account we are considering, has the majority of subscribers from Moscow.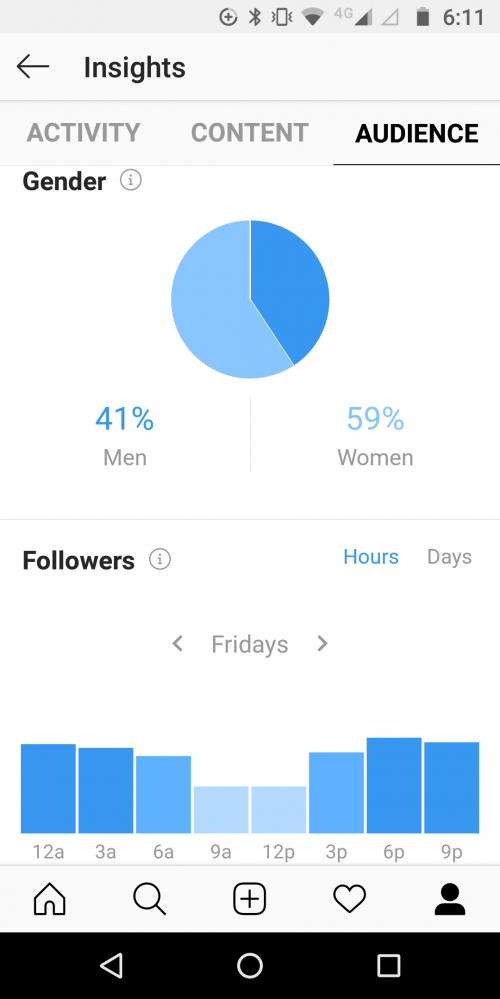
And by clicking on the button "Countries" , we will find out from which countries in what proportion we have subscribers. Also, most are expected from Russia, but there are also from Kazakhstan, the USA, Ukraine and even Brazil.
In the next section, we can see what age men and women are in our account.
We see that our subscribers are dominated by people aged 25 to 34 years, slightly less women and older men - from 35 to 44 years old. nine0003
Interestingly, our account is also followed by schoolchildren under the age of 17 and older people over 65. Where Instagram has gone!
Here we are shown that 71% of our subscribers are women, only 29% are men.
This section is called “Followers” for some reason, although it would be more correct to call it “Followers Activity”, because that is what it shows: at what time of the day and what days of the week your followers are most active on Instagram.