Instagram Insights shows you engagement analytics that empower you to improve your Instagram for Business strategy.
You no longer have to guess about what works for your audience; Instagram Insights will tell you. You’ll therefore be able to get more likes, earn more followers, and grow your profile exponentially.
In this post, we’ll go over everything you need to know about Instagram Insights and how to leverage it to improve your Instagram profile.
Instagram Insights is a feature that allows Instagram Business Account users to see analytics related to their profile and posts. From this data, you'll be able to identify what your audience likes and engages with the most to improve your Instagram strategy.
Instagram Insights allows you to get access to important user engagement data for your business profile. It’s not just enough to know the raw numbers, such as the amount of likes you get for one post. It’s important to understand your audience, too.
That’s where Insights comes in. It tells you how they do things, what they prefer, and who they are. You can certainly make business decisions based on gut feeling, but you're much more likely to hit the mark when you can validate assumptions with cold, hard facts.
Data and analytics help you measure the impact of your marketing efforts across different channels to see if there's something you need to do differently — like target a different audience, post at a certain time of day, or experiment with a new content format.
Social media isn't any different from other aspects of your marketing in the sense that it can be measured and improved upon. That's why you'll be able to create a more effective Instagram strategy using Instagram Insights.
To use Instagram Insights, you must first have a business profile. The good news? If you're already using a personal account, you can switch to a business profile right from your phone. Here's how to convert your account in a few simple steps.
You can convert your Instagram profile to a Business account directly from your Instagram mobile app. First up, open up the app and click on your profile picture on the bottom right-hand corner of your feed.
Next, it’s time to head to Settings. On your profile, click the hamburger icon on the top-right corner.
On the pop-up, click “Settings.”
 Tap "Account."
A list menu will come up. Tap “Account.”
By switching to a Professional account, you can get access to Insights immediately — even if you’re not a business.
Choose the best category that describes you. Once you’re finished, click “Done.”
After, go back to your profile. Here’s what it will look like:
As you can see, you can immediately access Insights with a Professional account. If you’re a freelancer or content creator, you can stay as is, or you can take the extra step of switching to a Business account.
If you’re a business, organization, or brand, you’ll want to take the additional step of turning your Professional account into a Business account. A Professional account gives you full access to Insights, but is designed for independent digital creators. A Business account is more apt for companies.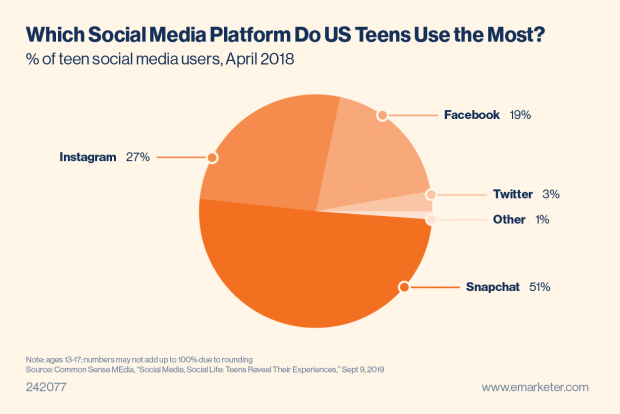
Note that turning your account into a Professional account always comes before switching to a Business account.
To turn your account into a Business account, click the hamburger menu in the top right corner of your profile. Click “Settings,” then “Account.” At the bottom, click “Switch Account Type.”
Then click “Switch to Business Account.”
Done! You’re now a Business account with access to Insights.
Lastly, if you have a Facebook Business page, it’s important to connect it to your Instagram Business or Professional account. To do so, go to your profile and click the “Edit Profile” button.
Under “Profile Information,” click “Connect Facebook page.” Follow the prompts to connect your Page or create a new one.
Be sure to already have a Facebook account prior to connecting your page. Click here for instructions for setting up your Facebook Page if you don't already have one.
Once you’ve set up your Professional or Business Account, you can begin to use Instagram Insights.
Before we get into specific instructions for using it, however, here are the analytics on this channel that marketers need to know and understand — and how to use them.
Let’s look at Instagram Insights from a bird’s eye view and zoom in piece-by-piece.
Insights Overview is the “home page” of Instagram Insights. Here, you’ll see how you’ve fared overall.
You get several pieces of information on this page:
Now, let’s go into “Accounts Reached,” “Accounts Engaged,” and “Total Followers” in more detail.
In Accounts Reached, you’ll see more specific information about the users who have seen your content and interacted with your profile in some way or form.
Lets’ break down the different pieces of information you’ll find in this page.
 You can see the number of website taps, business address taps, call button taps, email button taps, and text button taps. For these metrics to show up, however, you have to have set up those buttons.
Accounts engaged refers to the number of users who interacted with your content beyond just watching it or scrolling past it. Let’s break down the sections on this page.
The total followers page of Instagram Insights allows you to see the total number of users who follow you. You can also see follows, unfollows, top locations, age ranges, and genders.
Under total followers and its demographic breakdown, you’ll then see one more section: most active times.
To see post insights on Instagram, navigate to your Instagram profile and click the button that says “Insights” right above your posts. Alternatively, click the hamburger menu on the top right-hand corner and tap Insights. There, you’ll be able to see Insights for all of your posts, reels, live videos, and more.
Next, let’s go over how you can see insights for individual posts on Instagram.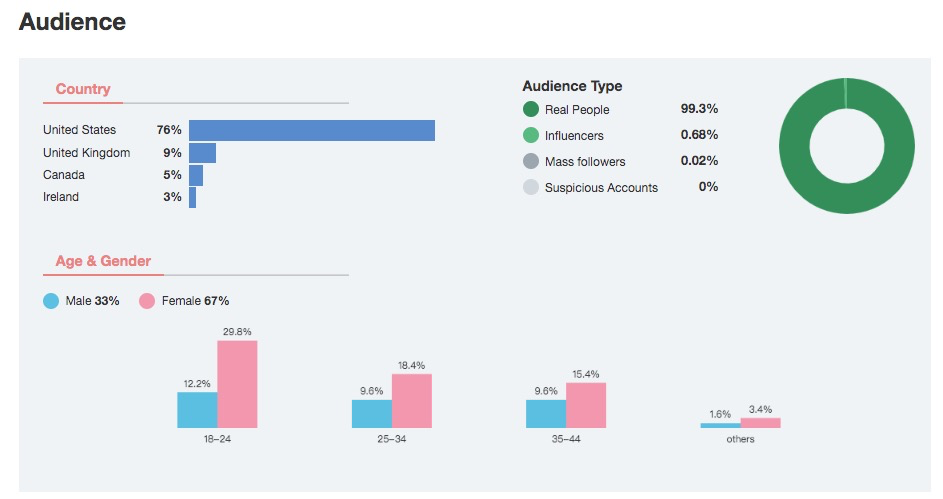
If your Story is currently live on your profile:
If your Story has already expired or more than 24 hours have passed:
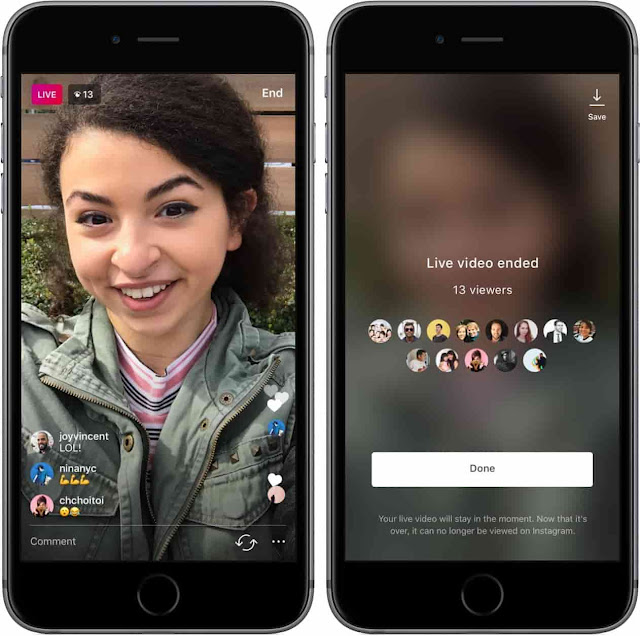
If you’ve just finished your Live video:
If you broadcasted your Live video in the past:
Next, we'll get into how to use Instagram Insights in your day-to-day.
Instagram Insights is a fantastic tool, but it can be hard to know what to do once you gain access. Here are some of the most useful ways you can use Insights as you grow your Instagram profile.
Click the Accounts Reached section. As mentioned, reach reflects the number of unique users that have seen any of your Instagram posts.
Within this category, you'll see insights for:
Some of these insights can be expanded for more insights.
On the Accounts Reached page under Account Activity, you'll be able to see Profile Visits.
Profile Visits reflects the number of times your profile has been viewed.
Find out how many of your profile visitors are turning into followers by dividing your number followers by the number of visitors. Track this number over time to find out whether your “conversion rate” is increasing or decreasing.
Website Taps can also be found under Accounts Reached > Profile Activity. This insight reflects the number of times any links you've included in your business profile have been clicked.
Navigate back to Insights Overview and tap Accounts Engaged. This will bring up a page that shows how your content is performing in terms of engagement, breaking down the metrics by content type.
Likes speaks for itself, reflecting the number of users who liked your post. As with likes, Comments reflects the number of comments left on your post. Saves highlights the number of unique users or accounts who saved your post. If any of these numbers are low, it’s important to reevaluate your Instagram strategy.
Navigate back to Insights Overview and click Total Followers. You'll then reach the Follower Breakdown page.
This page reflects how many followers you've gained or lost over the past week, as well as the average times of day when your followers are using Instagram — data that can be highly beneficial when planning posts.
To view insights for a specific Instagram post, start by visiting your profile. Tap on the post you'd like to look into, then click View Insights below the image
Under the “Profile Activity” section, you’ll find out the number of actions that users took on your profile as a result of seeing your post — things like visiting your profile, then taking an action like clicking on your website link or following you.
Previously named “Discovery,” Reach indicates where your post was seen — or discovered — the most, including how many accounts weren't already following you when they first saw the post.
This section includes metrics on Impressions, which reflect the number of times your post was discovered from a particular place within Instagram, like the user's home feed, a search, your profile, a location tag, or a hashtag.
Reach insights also include data on a post's reach — which reflects the number of unique accounts that saw your post.
Instagram users with a business profile are able to view insights into their ephemeral Stories.
To view your Story insights, navigate back to Insights and scroll down to Content You Shared section on the Insights Overview page.
Scroll down to the Stories section, and you'll be able to see insights for older stories, as well as any that have not yet expired.
Next, we'll get into the more specific insights you can explore.
This insight represents how many times your Story was seen.
When viewing these insights, keep in mind that you're able to add multiple images or videos to your Story. When you do this, every piece of visual content in your Story is counted as a single photo or video in your post.
Let's say you add six photos to your Story. Whether someone only views one or views all six, Instagram only counts your entire Story having received one impression.
The same goes for Story content that has been viewed by a single user more than once. Instagram still only counts that interaction as the entire Story having received one impression.
This insight reflects the number of unique users that have seen your Story.
This insight reflects the number of times a user taps your Story photo or video to skip to the next piece of media.
This insight reflects the number of times a user taps your Story photo or video to go back to the previous piece of media.
This insight reflects the number of times users send messages through the Send Message text box on your Story.
This insight reflects the number of times users swipe to skip to the next account’s Story — not to be mistaken for "tap forward," which reflects users skipping ahead to your next piece of Story media.
This insight reflects the number of times a user leaves the Stories section entirely to return to the home feed.
Now that you know how to access data to inform your strategy with Instagram Insights, you can analyze that data and determine what's working for your audience (and what's not). From there, creating content that gets a ton of engagement will be a lot easier as you consider those benchmarks.
Editor's Note: This post was originally published in January 2018 but has been updated for comprehensiveness.
Topics: Instagram Marketing
At the beginning of an account promotion, you probably don’t want to spend money for additional apps. Fortunately, you don’t have to. We will tell you how to use free Instagram analytics tool, the only one you actually need. Will tell you how to see metrics in the Insights and understand them. We will explain some rates that are important for your account promotion and give the formulas to check them in your account.
You can use metrics in Instagram Insights to analyze your marketing strategy for free. But it is available only in Professional accounts. If you have a Private one, switch it to a Business or Creator. Read on how to switch and set a profile for your brand.
You can go to Instagram Insights right from your profile page.
You can also check Instagram Insights by opening the settings.
Instagram Insights allows you to check general statistics on your profile page. You can change the period for which it is shown.
01. Disclose the menu on the left.
02. Choose the last 7, 14, 30, 90 days or Previous month. You can also set any period from 1 to 90 days. To do it, tap the day you need, or the first and the last days.
Bear in mind the difference between the Last 30 days and the Previous month. If you look at statistics on August, 15, in the first case you’ll get the data from July, 15 to August, 13, in the second — from July, 1 to July, 31.
03. Tap Update.
In the first line, you can see what metrics in Instagram Insights changed most of all. It compares two periods of the same length following one another. For periods of different lengths the displayed metric may differ.
Let's look at the examples to get a better understanding how to check Instagram Insights. During the last 14 days, our content has been watched by almost 500% more users than during the previous 14 days. But if we choose a 30 days time interval, Instagram shows gaining subscribers as the biggest improvement for the period.
If there wasn’t any improvement for the chosen period, IG suggests you take a deeper look at how your account and content are performing. Go to the sections below to see this in Instagram Insights.
Accounts Reached shows the number of users who saw your content. Tap the section in your Instagram Insights to see more comprehensive statistics.
Under the number of users for the period, you’ll see the comparison with the previous period.
Below you can learn:
Instagram Insights Impressions, unlike Reach, includes views of one and the same user. It means if 1 user saw your photo twice, the Reach rate will be 1, but Impressions — 2.
Now look how to check Interactions in Instagram Insights. This rate refers to the users’ reactions to your content. It includes likes, comments, saves and shares. Even if you hide likes count, you will see its number here.
This section of Instagram Insights is divided by the type of content. Under each one you can see the dynamic in comparison with the previous period.
In this Instagram Insights section, you can view more about your subscribers. The metrics are available for those who've got more than 100 followers.
Look at the number at the top to check how many Instagram followers you’ve got during the period. Below you see the analytics — growth or falling of the number of followers during a chosen time interval.
It is followed by the number of subscribed and unsubscribed users for the period. The graphic reveals daily Instagram stats. Get on a particular day, then the numbers will be shown for the date. Tap the cross appeared near the date to see the figures for the whole period again.
At the bottom you will see your Instagram followers Insights. There are location, gender, age and time of the highest activity metrics. This data is for all the followers you’ve got, not only for those gained in the chosen period.
The Content You Shared section is divided by the type of content. In each one you will see recently added photos and videos.
Tap on the content type and number to navigate to the sorting page. Each type of content has its own metrics to analyze.
Open an Instagram post, Stories, Reels, IGTV, and tap View Insights. To see the data for Lives, just tap them from the Content You Shared page. In the Insights you’ll see all available metrics, but specifically for a chosen publication.
In post Instagram Insights, you can look at an extra metric to see where people viewed them. An IGTV metrics additionally tells you what time people leave the Instagram video.
From the Content You Shared page, you can see Instagram Insights for publications added in the profile for the last two years. Set a time filter to hide old publications, then it’ll be easier to check the new ones. Whatever period filter you choose, you get your Instagram publications Insights collected during all time since they’ve been added.
In Creator Studio you can see Instagram stats for publications added since 2009. We wrote about the service here. Comments, likes and views are in the Content Library section. Audience statistics and analytics for the last 7 days are displayed in the Insights section.
Now you know where to view Instagram Insights. Let's get to its understanding. To begin with, choose a time interval.
Below we will tell you about several Instagram Insights indexes to appraise your account promotion. The bigger the index, the better. First of all compare your indexes with those you can calculate for the previous periods. Growing figures means development.
To make the possibilities clear, and to understand what stage you are at, we suggest using research data as guide standards. You can find it below.
If you watch the number of subscribers is growing — it’s good.
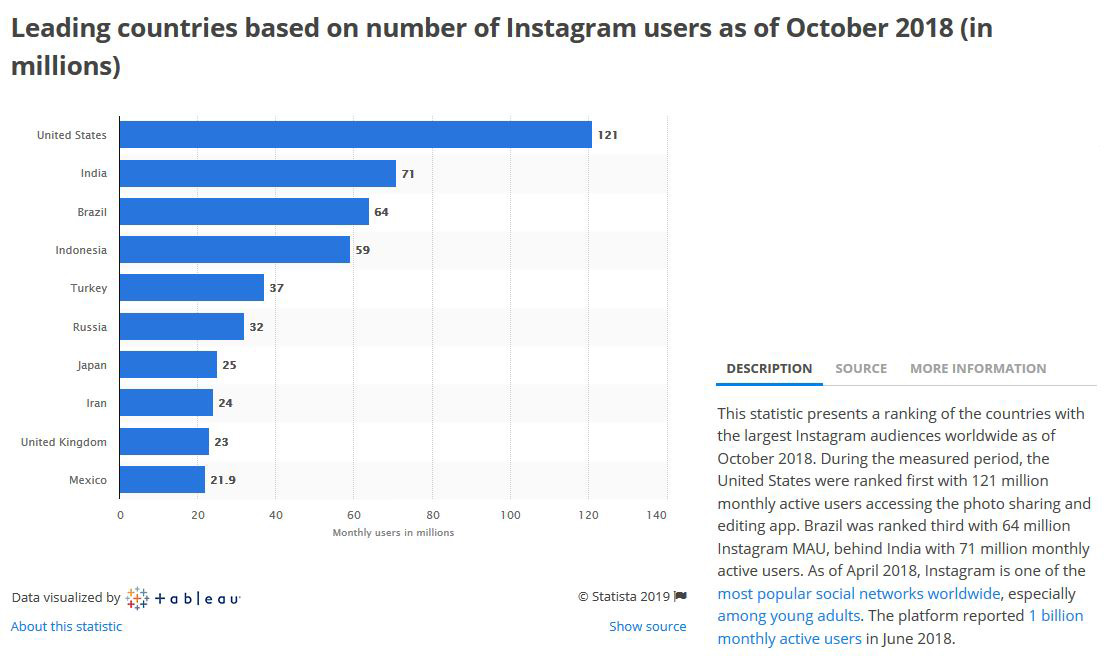
According to the statista. com data, the average followers growth for half a year is different and depends on the initial number of followers. On average it is 12.6%
Don’t enjoy watching your followers growth too much. Part of them might be bots. You should delete them. We wrote why and how to do it here. More to that, if your audience doesn't interact with your content, and does not even watch it, it’s a bad signal for the algorithms. Even if your content is incredible, small audience engagement will hinder your promotion.
For example, (51/4957)*100=1%.
Social insider in collaboration with bannersnack figured out Instagram average engagement rate for posts. It is 1.92% for photo posts, 1.74% for video, and 1.45% for carousels. The average Instagram engagement for all posts is 1.7%.
We suggest calculating the engagement for your Instagram posts. Compare it with the average engagement rate of 1.7% to get a sense of your social media marketing strategy effectiveness.
For example, (2/99)*100%=2%
See Instagram Insights to understand what to publish. Likes tell us what photo and videos users like. At the same time you should consider the number of people who watched the content. If an Instagram post was liked by 10 people and watched by 1000, it is probably in favor of the audience. But not as much as the one liked by 10 people out of 100 watched.
You can also calculate the metric for an individual Instagram post by dividing the likes by Reach, or specifically for a single Reels and IGTV by dividing likes by Plays from the relevant sections.
For example, ((27+2+11)/4957)*100%=0.8%
You can see the like numbers in your post Insights on Instagram decreasing. Thus, the rate falls too. There can be two reasons. Understand your case and fixing the situation require the following calculations:
 Then multiply by 100%. A small number might mean you chose the wrong hashtags.
 Analyze what content with the highest rate numbers has in common. Thus, you figure out what your audience likes most of all.
Regardless of whether the comments under your content are positive or negative, their presence in the Instagram Insights means you succeed at making your audience interested in it. They might be piqued by a photo or video, or the caption provoked them for a discussion. To find the pattern, first figure out the most discussed content.
For example, (1/23)*100%=4.4%
The formula is applicable to an individual Instagram post or the video. Thus, you can monitor the general dynamic and know whether you are keeping the right direction.
Use the same formulas to check your Instagram Stories Insights. But instead of Reach and Plays see Views in the Insights, and instead of likes — reactions.
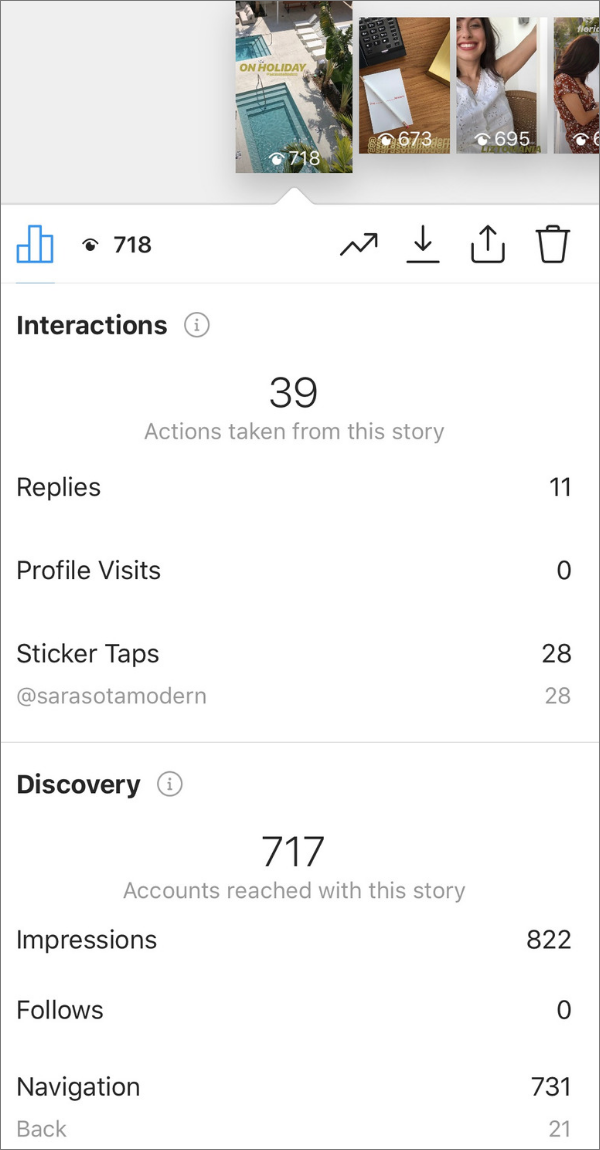
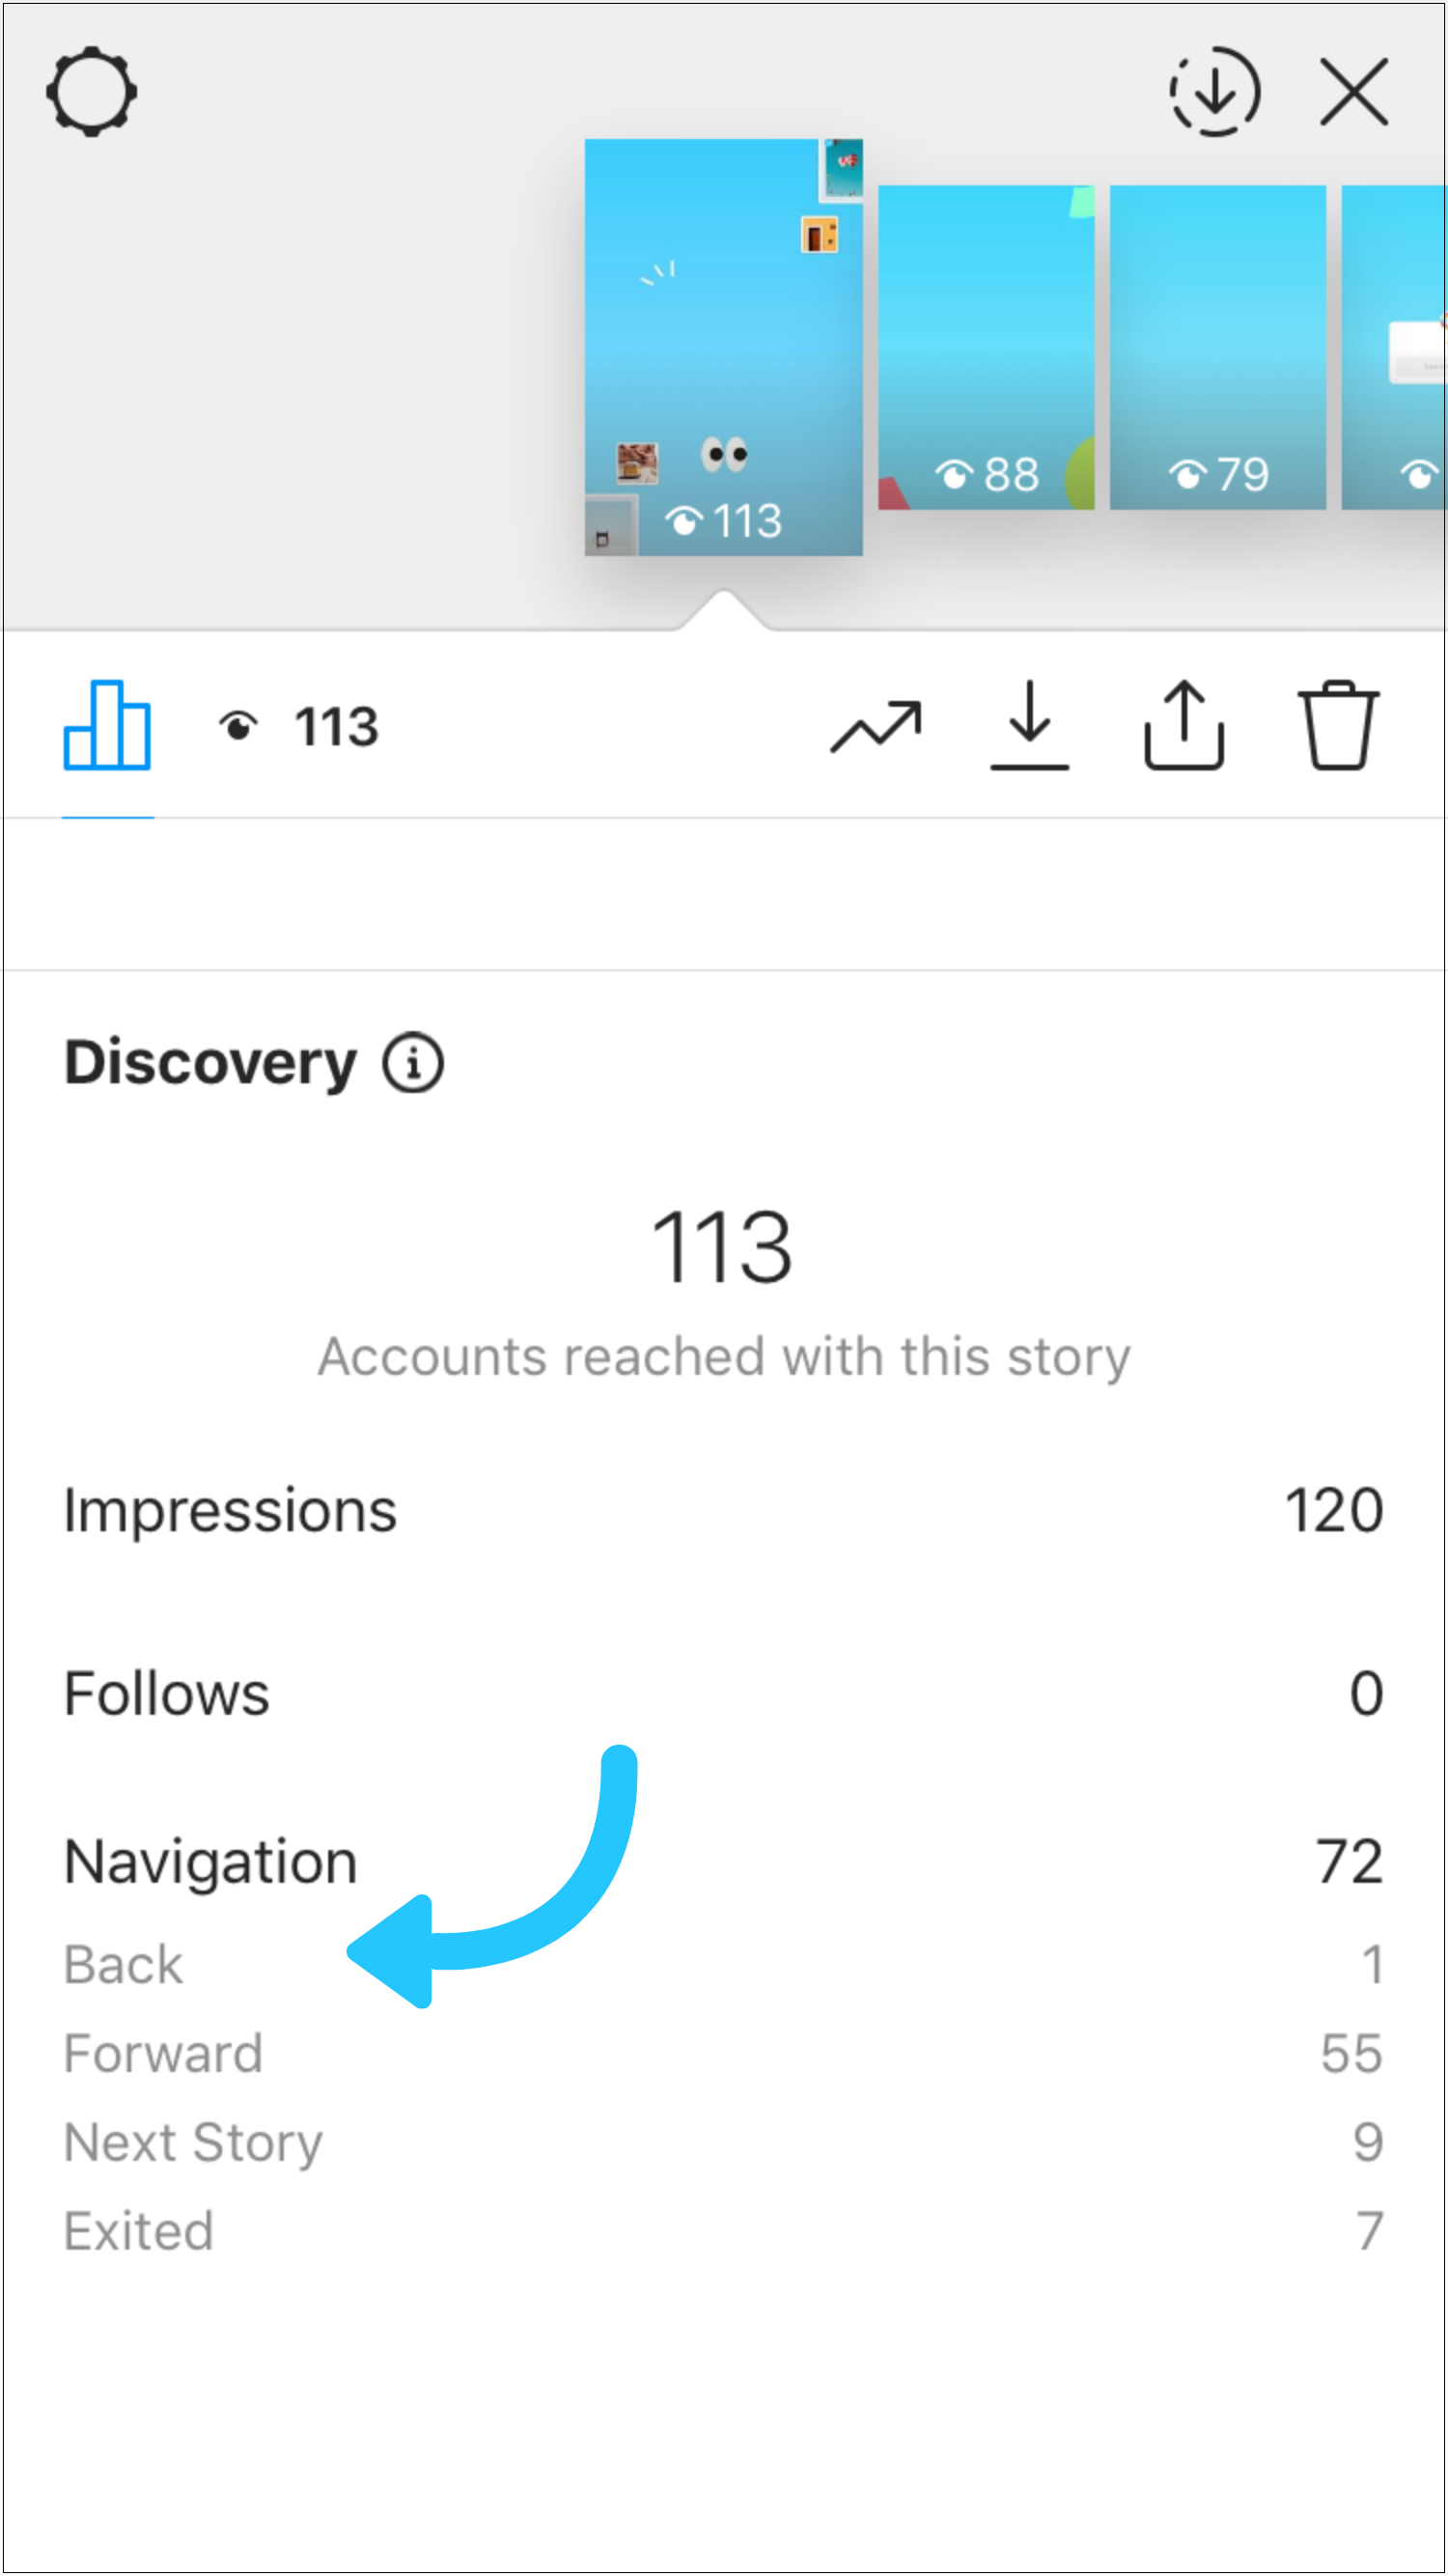
Besides, look at where users go from a Story. If Instagram Insights says they go back (1), it means they like the content and want to see it again.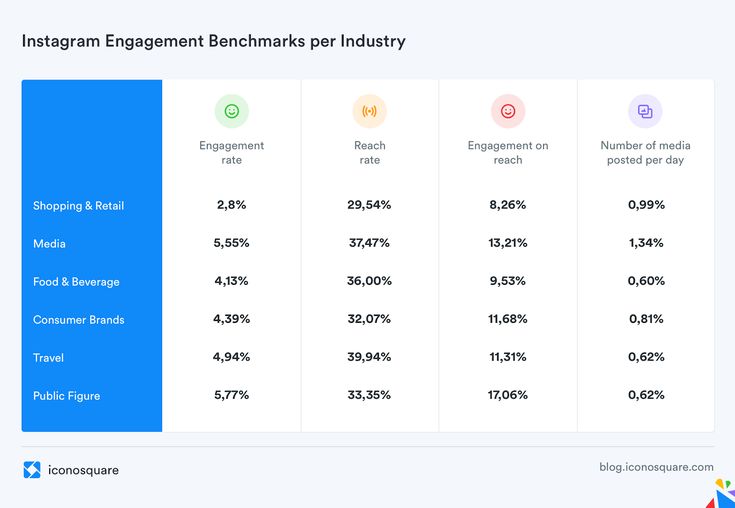 If exit (2) — just the opposite. Understanding what content motivated the users to navigate a link in a Story will also be useful (3).
Live Videos metric that you should see in your Instagram Insights is Peak Concurrent Viewers. The bigger the number, the more your audience is interested in your Lives.
Most Active Times in your Instagram Insights help to understand when to publish content. You can find it in the Audience section.
In this Instagram Insights section you can see your audience age, gender and location. Publish content which will be close to the people of such age, gender and country.
If you use Taplink, don’t forget about the statistics section available in the service. There are less metrics than in Instagram Insights, but they will give you sound knowledge about your audience.
Clicks on links will give your Instagram audience insights — what thay are interested in most of all, and what chatting app they use more often. The statistics are represented both in numbers and demonstrable graphs. Use the section to get your Instagram audience insights:
If you are interested in Instagram promotion, but don’t use Taplink, it's prime time to sign up. The article that will help you:
In this article, we told you how to see and understand Instagram Insights. It does not give straight answers to the questions of what and when to post. Still, you should use its metrics to find the answers yourself.
Calculate the engagement individually for a post, Story, Reel and IGTV to understand what content interests your audience most of all. Calculate the average engagement and followers growth to estimate the effectiveness of your social media marketing strategy.
Tell in the comments below — do you think Instagram Insights is sufficient for free Instagram analytics?
.
Instagram account statistics could only be viewed using third-party services and programs, but now it can be done in your own account and even from a computer to Facebook in Creator Studio. Where is this statistics and how to do it on Android and iPhone?
Instagram statistics for the account as a whole, individual publications and Stories can be viewed for free, but first you need to create a business account or an author account.
👉 How to make a business account on Instagram
You will get statistics of the photo and the whole account after switching to a business profile or author account . You can do this for free. Previously, it was necessary to link the Facebook page. But now this can not be done.
But in order to run ads directly in the application, Facebook still has to be linked. To do this, you need to remember your e-mail and password from your Facebook account, as well as create a public page for your business account.
After transferring to a business account or an author account, you will see the inscription “View professional panel” and the “Statistics” button at the top.
If you immediately click the button, then you will immediately go to the Statistics of your Instagram profile.
If you click "View professional panel" - then you can see all the tools for working with a business account / author account. Including there will be a line "all statistics".
The third way to view Instagram statistics - in your account, click the three bars on the top right and select "Statistics"
Instagram account statistics can only be viewed from the current moment. Everything that happened before, no one will ever know =) Therefore, you will see some intelligible statistics for the entire account within a week, and only new posts will have photo and video statistics.
Statistics are needed not only to track the progress of an account, but also for potential advertisers who ask for the Reach and Engagement of an account before buying an ad.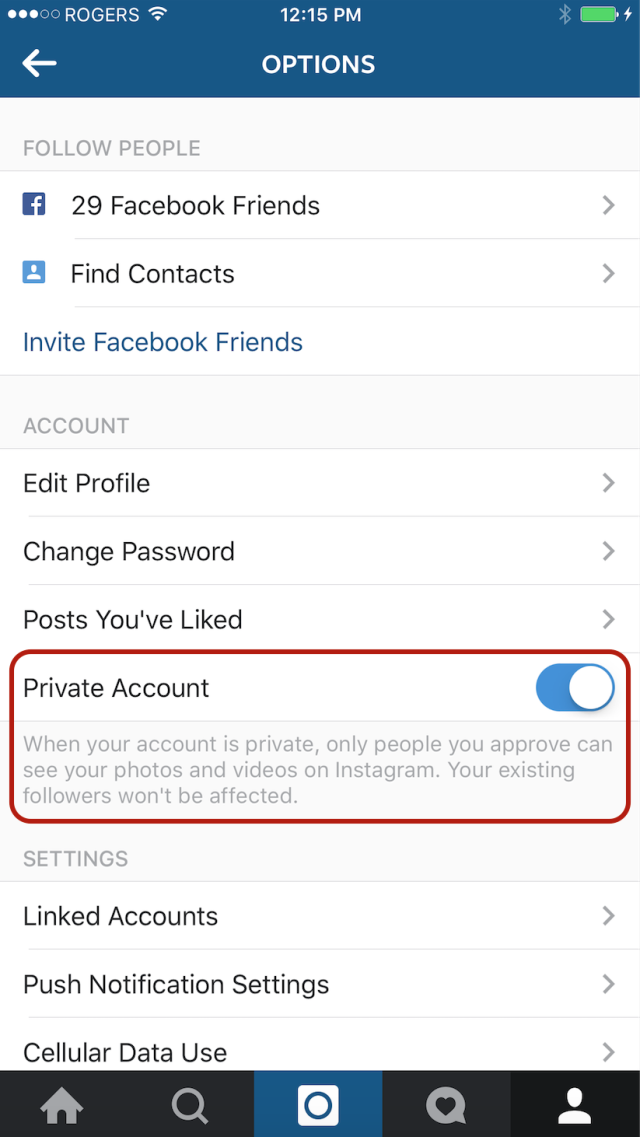 What does Instagram stats mean?
On the main screen, you can select the period from the top - statistics for the last 7 days or 30 days.
Accounts Reached - is the total number of people who saw your posts, Stories and IGTV) in a week, plus a comparison with last week. It differs from Impressions in that here each person (account) is counted only once, even if he watched your posts several times. Therefore, Reach will always be less than Impressions.
👉 Instagram reach: what is it and how to increase it?
Click on Covered accounts and more detailed statistics will open.
Subscribers and everyone else (by reach) - how many of the audience covered were subscribed to you, and how many were not.
Content type - which content received the most coverage (also broken down by subscribers and unsubscribers)
Here you can also see which posts were the most popular in terms of reach. And if you press the triangle bracket 9 on the right0013 > , then you can filter statistics on Instagram by other indicators (comments, likes, subscriptions, etc.).
Impressions is the total number of content views. One person could watch several times, different content. Therefore, impressions are always more reach.
Actions in the profile are visits to your Instagram account plus clicks on the buttons in the account header (email, store, phone, etc.).
YOUR AUDIENCE
Return to the first Instagram Insights screen. In the Your Audience section, click the triangle bracket on the right > . Statistics on subscriptions and unsubscribes on Instagram will open.
Increase - on this graph you will see the number of subscribers, unsubscribers and total (subscriptions minus unsubscribes).
Below are statistics by location, age and gender.
Peak periods - time (days and hours) when followers were most often on Instagram.
CONTENT YOU POSTED
Go back to the first Instagram Statistics screen. In the "Content you've posted" section, you'll see the number of posts/Stories/IGTV/Promotions in the last 7 or 30 days (depending on the filter on the top left). For each type of content, you can filter by all engagement indicators (impressions/reach/likes (likes)/comments/saves).
This will help you better understand the results of advertising from bloggers or giveaways. But this is only available for profiles with more than 10,000 subscribers. You can wind them up and go to the author’s account in this way, especially if you don’t have enough 1000 subscribers and can’t wait to get new statistics right now. This will not hit the account engagement much. But ideally, of course, you need to grow organically, with the help of advertising from bloggers and targeting.
To find out the statistics of views (and not only) of each publication - photo or video on Instagram, you need to open the desired post and click "Statistics".
The top line of statistics is the number of likes, comments (👉 Comments on Instagram: how to talk subscribers), transfers to Direct and saves.
Saves - how many times the "save" button was pressed.
Visits to profile - how many times they went to the account from this photo.
Reach - how many people viewed the photo. On average, there should be 30-60% of subscribers. Less - a lot of bots that do not look at posts. More — if you ran an ad, got featured, the post turned out to be very popular, shared, etc. The larger your account, the smaller the reach in % of subscribers. Old followers abandon accounts or lose interest. This is fine. The highest coverage (in % of subscribers) is for accounts with up to 1000 subscribers. To increase your reach, be sure to post regularly, with a content plan. Also, according to the coverage statistics on Instagram, you can understand whether you published a post at the right time or not.
If you swipe up on these statistics on Instagram, you can find out even more interesting things about the statistics of the post.
Profile visits - how many people went to your account after seeing this post
Reach - how many people saw your post.
Impressions - how many times your post was viewed. One person can view multiple times, so impressions are always more than reach.
From main page - how many people saw the post in the feed
From "Interesting" - views from the recommended tab, with a magnifying glass. The more, the more likely that the post has become "viral" (it is sent to friends, it appeared in the recommended). Also, a large percentage happens if you promoted a post.
From profile — how many people saw the post by logging into your account
From hashtags — how many came from hashtags
From “other” - all other sources
In a personal account, you can only see the total number and accounts of those who saw your Stories. To do this, swipe up from the bottom of any Story on Instagram.
After switching to a business or author account, you will have detailed statistics for each Instagram Stories. What does each statistic mean?
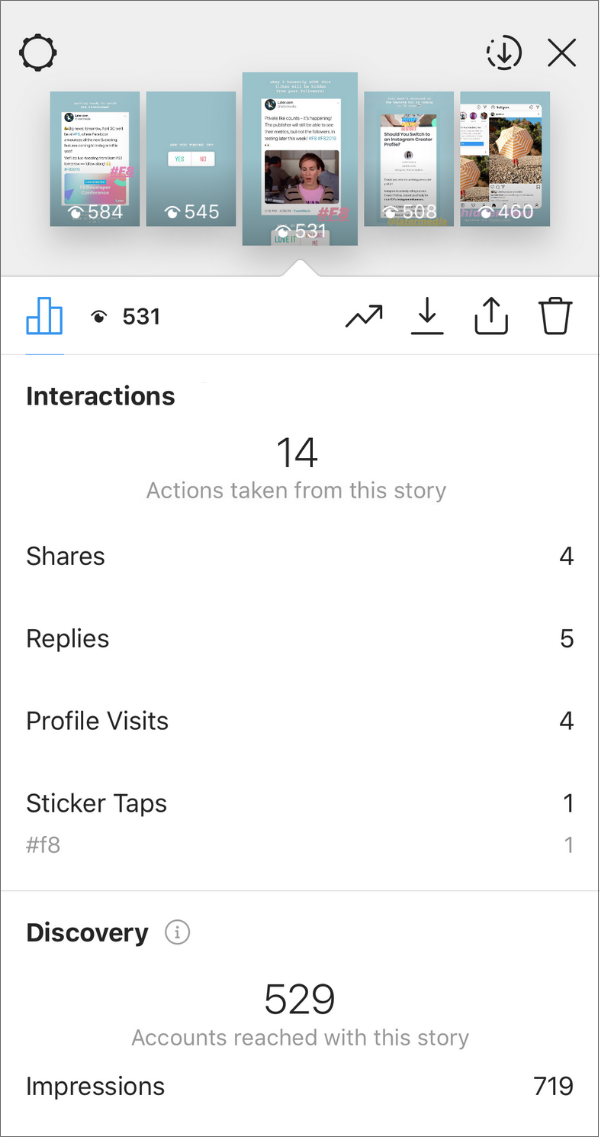
INTERACTIONS
Total statistics on the number of reactions to your Stories:
Replies — how many people answered you in Direct on this Story
Clicks on the link — how many times after this Story they went to your account and clicked on the link in the description.
Visits to profile - how many times after this Story they went to your account.
REACH STATISTICS
Here you will see statistics on how many people see your Stories and how they find them:
Accounts covered by this Story (Reach) - total number of people who saw this Story
Impressions - how many times this Story was viewed .
Subscriptions — how many subscriptions after this Story.
Navigation = back + scroll forward + jumps to next Story + exits0003
Forward - Number of taps forward to view your next Story
Next Story - Number of scrolls to the next account's Stories. Here you can understand whether was interesting or not was History , whether a person wanted to watch your content further or moved to the next account.
Exits — number of exits from the Stories view mode. Again, you can see the statistics of how the Story was able to keep the attention of subscribers.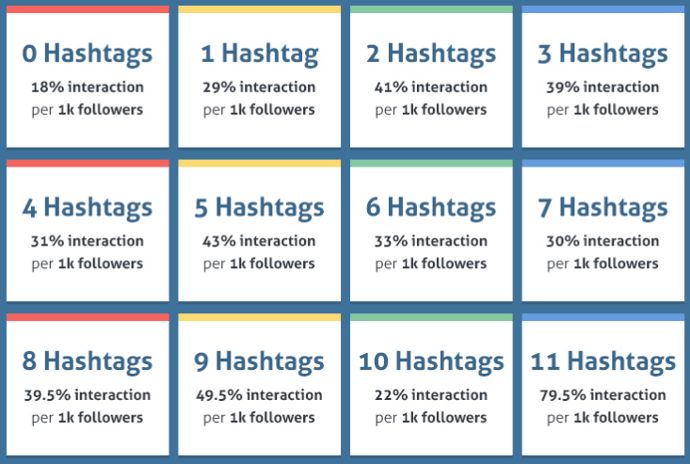
Do not draw conclusions after the first week, how to connect free statistics on Instagram. Check how it will change for at least a month. Compare weekdays, weekends and holidays, good/bad weather outside.
Don't be in a hurry to "give it all away" if your coverage dropped in late spring and summer. Previously, no one had such statistics, and people who do not know the general trends in social networks and the Internet are afraid of fluctuations in statistics in their Instagram account. In the fall and after the New Year holidays, there is always an increase, and in the spring and summer there is an outflow. Of course, this does not apply to "seasonal" businesses (spring-summer travel agencies have growth, for example).
Even though many of us have a smartphone as an extension of our hand, we still scroll through Instagram less when we are on vacation, it’s summer outside, etc. Therefore, do not rush to arrange another giveaway or pour extra money on advertising if your coverage decline is seasonal. But do not abandon your account, if necessary, make pending posts for the holidays. Then even if you yourself are resting, you will still flicker in the feed of subscribers.
You will have the most reliable statistics a year after you make it. Therefore, it is best if you monitor your indicators on Instagram and write them down separately, noting what you did - cheating, advertising with bloggers, advertising (targeting), other promotion methods.
Instructions for those who are not in the know.
Amplifier
revision
We tell you who and how the built-in statistics in Instagram is useful. The product belongs to an organization recognized as extremist in the Russian Federation, and where to find it. We have already told you what she can do.
Statistics help you find out what kind of people are following you at InstagramThe product belongs to an organization recognized as extremist on the territory of the Russian Federation, which posts they like. This information is useful if you are promoting a business on social networks or want to make money on a blog. By working with statistics, you end up selling more or increasing interest in yourself.
Read about the metrics InstagramThe product belongs to an organization recognized as extremist in the Russian Federation. to navigate the statistics
Statistics has three sections: actions, content, and audience. In the Actions tab, general profile metrics, such as reach, impressions, and visits. In the "Audience" section - the age and gender of subscribers, the cities and countries in which you are read, the time when subscribers are active. The "Content" section shows how your publications and "Stories" are viewed - analytics is available for each post.
Learn how to connect a business account and see profile statistics
Statistics in InstagramThe product belongs to an organization recognized as extremist on the territory of the Russian Federation.
is only available to business account holders. You can view personal profile metrics in Amplifer. It summarizes reach and engagement data, recommends the best time to post, and shows which posts your audience likes.
InstagramThe product belongs to an organization recognized as extremist in the Russian Federation. 1. Open the mobile application InstagramThe product belongs to an organization recognized as extremist in the territory of the Russian Federation. and swipe left from your profile;
2. Click the button Statistics - it is located in the upper right corner;
3. That's it, you've opened statistics on Instagram*.
Try Amplifer: it will post on Instagram* at the right time and tell you what posts your followers like. Two weeks is free.


:max_bytes(150000):strip_icc()/001-did-someone-block-you-on-whatsapp-4157806-7ff319323de34af09e06bcb3fafaa012.jpg)