Instagram Insights shows you engagement analytics that empower you to improve your Instagram for Business strategy.
You no longer have to guess about what works for your audience; Instagram Insights will tell you. You’ll therefore be able to get more likes, earn more followers, and grow your profile exponentially.
In this post, we’ll go over everything you need to know about Instagram Insights and how to leverage it to improve your Instagram profile.
Instagram Insights is a feature that allows Instagram Business Account users to see analytics related to their profile and posts. From this data, you'll be able to identify what your audience likes and engages with the most to improve your Instagram strategy.
Instagram Insights allows you to get access to important user engagement data for your business profile. It’s not just enough to know the raw numbers, such as the amount of likes you get for one post. It’s important to understand your audience, too.
That’s where Insights comes in. It tells you how they do things, what they prefer, and who they are. You can certainly make business decisions based on gut feeling, but you're much more likely to hit the mark when you can validate assumptions with cold, hard facts.
Data and analytics help you measure the impact of your marketing efforts across different channels to see if there's something you need to do differently — like target a different audience, post at a certain time of day, or experiment with a new content format.
Social media isn't any different from other aspects of your marketing in the sense that it can be measured and improved upon. That's why you'll be able to create a more effective Instagram strategy using Instagram Insights.
To use Instagram Insights, you must first have a business profile. The good news? If you're already using a personal account, you can switch to a business profile right from your phone.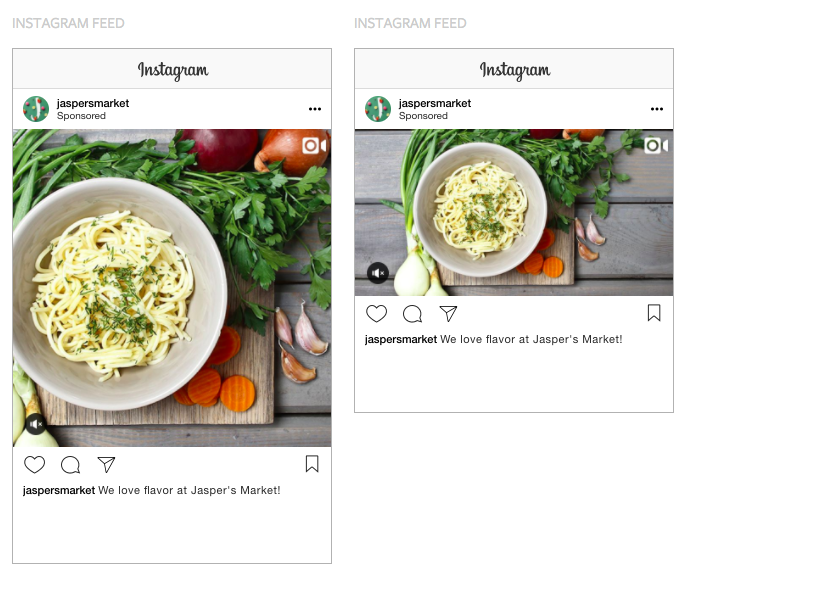 Here's how to convert your account in a few simple steps.
You can convert your Instagram profile to a Business account directly from your Instagram mobile app. First up, open up the app and click on your profile picture on the bottom right-hand corner of your feed.
Next, it’s time to head to Settings. On your profile, click the hamburger icon on the top-right corner.
On the pop-up, click “Settings.”
 Tap "Account."
A list menu will come up. Tap “Account.”
By switching to a Professional account, you can get access to Insights immediately — even if you’re not a business.
Choose the best category that describes you. Once you’re finished, click “Done.”
After, go back to your profile. Here’s what it will look like:
As you can see, you can immediately access Insights with a Professional account. If you’re a freelancer or content creator, you can stay as is, or you can take the extra step of switching to a Business account.
If you’re a business, organization, or brand, you’ll want to take the additional step of turning your Professional account into a Business account. A Professional account gives you full access to Insights, but is designed for independent digital creators. A Business account is more apt for companies.
Note that turning your account into a Professional account always comes before switching to a Business account.
To turn your account into a Business account, click the hamburger menu in the top right corner of your profile. Click “Settings,” then “Account.” At the bottom, click “Switch Account Type.”
Then click “Switch to Business Account.”
Done! You’re now a Business account with access to Insights.
Lastly, if you have a Facebook Business page, it’s important to connect it to your Instagram Business or Professional account. To do so, go to your profile and click the “Edit Profile” button.
Under “Profile Information,” click “Connect Facebook page.” Follow the prompts to connect your Page or create a new one.
Be sure to already have a Facebook account prior to connecting your page. Click here for instructions for setting up your Facebook Page if you don't already have one.
Once you’ve set up your Professional or Business Account, you can begin to use Instagram Insights.
Before we get into specific instructions for using it, however, here are the analytics on this channel that marketers need to know and understand — and how to use them.
Let’s look at Instagram Insights from a bird’s eye view and zoom in piece-by-piece.
Insights Overview is the “home page” of Instagram Insights. Here, you’ll see how you’ve fared overall.
You get several pieces of information on this page:

Now, let’s go into “Accounts Reached,” “Accounts Engaged,” and “Total Followers” in more detail.
In Accounts Reached, you’ll see more specific information about the users who have seen your content and interacted with your profile in some way or form.
Lets’ break down the different pieces of information you’ll find in this page.
 You can see the number of website taps, business address taps, call button taps, email button taps, and text button taps. For these metrics to show up, however, you have to have set up those buttons.
Accounts engaged refers to the number of users who interacted with your content beyond just watching it or scrolling past it. Let’s break down the sections on this page.
The total followers page of Instagram Insights allows you to see the total number of users who follow you. You can also see follows, unfollows, top locations, age ranges, and genders.
Under total followers and its demographic breakdown, you’ll then see one more section: most active times.
To see post insights on Instagram, navigate to your Instagram profile and click the button that says “Insights” right above your posts. Alternatively, click the hamburger menu on the top right-hand corner and tap Insights. There, you’ll be able to see Insights for all of your posts, reels, live videos, and more.
Next, let’s go over how you can see insights for individual posts on Instagram.
If your Story is currently live on your profile:
If your Story has already expired or more than 24 hours have passed:
If you’ve just finished your Live video:
If you broadcasted your Live video in the past:
Next, we'll get into how to use Instagram Insights in your day-to-day.
Instagram Insights is a fantastic tool, but it can be hard to know what to do once you gain access. Here are some of the most useful ways you can use Insights as you grow your Instagram profile.
Click the Accounts Reached section. As mentioned, reach reflects the number of unique users that have seen any of your Instagram posts.
Within this category, you'll see insights for:
Some of these insights can be expanded for more insights.
On the Accounts Reached page under Account Activity, you'll be able to see Profile Visits.
Profile Visits reflects the number of times your profile has been viewed.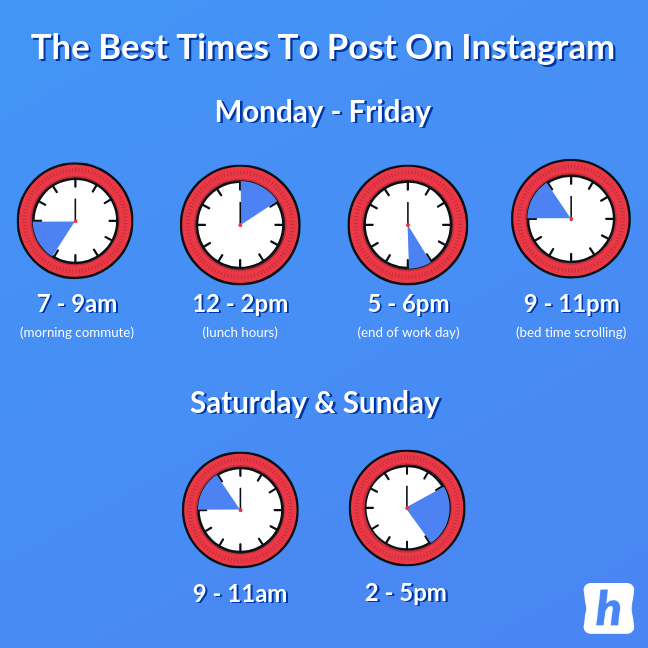
Find out how many of your profile visitors are turning into followers by dividing your number followers by the number of visitors. Track this number over time to find out whether your “conversion rate” is increasing or decreasing.
Website Taps can also be found under Accounts Reached > Profile Activity. This insight reflects the number of times any links you've included in your business profile have been clicked.
Navigate back to Insights Overview and tap Accounts Engaged. This will bring up a page that shows how your content is performing in terms of engagement, breaking down the metrics by content type.
Likes speaks for itself, reflecting the number of users who liked your post. As with likes, Comments reflects the number of comments left on your post. Saves highlights the number of unique users or accounts who saved your post. If any of these numbers are low, it’s important to reevaluate your Instagram strategy.
Navigate back to Insights Overview and click Total Followers. You'll then reach the Follower Breakdown page.
This page reflects how many followers you've gained or lost over the past week, as well as the average times of day when your followers are using Instagram — data that can be highly beneficial when planning posts.
To view insights for a specific Instagram post, start by visiting your profile. Tap on the post you'd like to look into, then click View Insights below the image
Under the “Profile Activity” section, you’ll find out the number of actions that users took on your profile as a result of seeing your post — things like visiting your profile, then taking an action like clicking on your website link or following you.
Previously named “Discovery,” Reach indicates where your post was seen — or discovered — the most, including how many accounts weren't already following you when they first saw the post.
This section includes metrics on Impressions, which reflect the number of times your post was discovered from a particular place within Instagram, like the user's home feed, a search, your profile, a location tag, or a hashtag.
Reach insights also include data on a post's reach — which reflects the number of unique accounts that saw your post.
Instagram users with a business profile are able to view insights into their ephemeral Stories.
To view your Story insights, navigate back to Insights and scroll down to Content You Shared section on the Insights Overview page.
Scroll down to the Stories section, and you'll be able to see insights for older stories, as well as any that have not yet expired.
Next, we'll get into the more specific insights you can explore.
This insight represents how many times your Story was seen.
When viewing these insights, keep in mind that you're able to add multiple images or videos to your Story. When you do this, every piece of visual content in your Story is counted as a single photo or video in your post.
Let's say you add six photos to your Story. Whether someone only views one or views all six, Instagram only counts your entire Story having received one impression.
The same goes for Story content that has been viewed by a single user more than once. Instagram still only counts that interaction as the entire Story having received one impression.
This insight reflects the number of unique users that have seen your Story.
This insight reflects the number of times a user taps your Story photo or video to skip to the next piece of media.
This insight reflects the number of times a user taps your Story photo or video to go back to the previous piece of media.
This insight reflects the number of times users send messages through the Send Message text box on your Story.
This insight reflects the number of times users swipe to skip to the next account’s Story — not to be mistaken for "tap forward," which reflects users skipping ahead to your next piece of Story media.
This insight reflects the number of times a user leaves the Stories section entirely to return to the home feed.
Now that you know how to access data to inform your strategy with Instagram Insights, you can analyze that data and determine what's working for your audience (and what's not). From there, creating content that gets a ton of engagement will be a lot easier as you consider those benchmarks.
Editor's Note: This post was originally published in January 2018 but has been updated for comprehensiveness.
Topics: Instagram Marketing
Knowing that social media marketing is essential for businesses today, many business owners and teams invest time in creating profiles and posting content regularly. But, there’s more to leveraging social media for business than many realize.
While those activities are a big part of what social media marketing entails, it’s easy to forget that social media engagement is equally important if you hope to get real results. Taking the time to analyze your audience’s behavior and to interact is essential if you want to expand your reach, increase your engagement, and get more customers from social media.
Let’s dig a little deeper into:
Only when you understand all three can you unleash the full power of social media to grow your business!
5 Reasons Social Media Engagement Is a Big Deal
Why can it be said that social media engagement is just as important as consistently posting to your social profiles? Consider five desirable results it achieves.
1. Social Media Engagement Improves Audience Quality
If you focus on racking up a ton of followers but forget about engagement, you’ll run into one of a few problems. Either you’ll end up with many low-quality followers, more followers than you know what to do with, or struggle to get any followers at all. Since the ultimate goal behind social media marketing is to drive bottom-line business results, none of those three scenarios are desirable.
Image Source
On the flip side, if you engage regularly with your audience, you’ll be able to pace your social media growth, keep it manageable, and build a quality following of potential customers.
2. Social Media Engagement Can Improve Your Marketing ReachLots of engagement on social media allows you to cast a wider net in terms of marketing. For example, if just 10 of your followers or fans like, comment, or retweet to their own networks, your content could be seen by more than 100 additional potential customers. This is especially true on platforms like Facebook, which choose how much visibility your posts get based on how much engagement you typically receive. So it’s worthwhile to encourage your audience to take action when consuming your content on social.
Not only will more people see your content, but they’ll be more likely to have meaningful interactions with you themselves. And that likelihood only increases when you get into the habit of engaging back by replying to comments, retweeting quote tweets, and so on!
3. Social Media Engagement Expands Your Ad AudienceAs an extension of our last point, another benefit of social media engagement is an expanded ad audience. Facebook, Instagram, and Twitter all offer low-cost advertising to reach your friends and followers, as well as others with similar characteristics. So the larger your existing following on these platforms, the more people you can also reach through advertising.
Image Source
4. Social Media Engagement Amasses Social Proof for Your Business
One of the most powerful tools in marketing, social proof includes likes, followers, positive comments, and so on. The more genuine social proof you earn from your audience, the more confidence prospective customers will have in your business. They’ll get the innate sense that you’re doing something right and that, as a result, you’re worth their time and attention.
5. Social Media Engagement Can Lead to an Increase in New & Repeat SalesResearch has shown that nearly 9 in 10 consumers buy from businesses they follow on social media and that they tend to spend around 75% more with those businesses. So, in addition to providing quality content, if you focus on creating repeated positive interactions with your audience, you can generate quite a bit of new and repeat business.
How to Check Engagement on Top Platforms
Now that we’ve covered why engagement is important and its benefits, let’s move on to how to check your engagement on four of the most popular social media platforms — Facebook, Instagram, Twitter, and LinkedIn.
Facebook’s Engagement Rate consists of the total number of clicks, likes, comments, and shares. To check your engagement on Facebook:
Image Source
How much engagement should you be aiming for on Facebook? As you may know, Facebook penalizes pages with low engagement rates. When your audience rarely engages with your posts, Facebook shows them to fewer people over time. Therefore, you want as much engagement as possible so that your posts are shown to as many people as possible.
Statistically speaking, anything over 1% is good, 0.5% to 0.90% is the median across all industries, and anything below 0.5% needs improvement. Keep in mind, though, that because comments and shares require more from a user than simply liking posts, they carry more weight and are a better indicator of what messaging works best for your audience.
If you have an Instagram Business Profile, you have access to engagement analytics.
Here’s how to find them.
Image Source
You can also click Insights on individual posts to see the number of likes, comments, shares, bookmarks, and other interactions.
And although you absolutely should have an Instagram Business profile for the most accurate data and efficient monitoring, you can keep tabs on your engagement without one.
You can do so manually by:
In either case, what’s a good Instagram engagement rate to shoot for? The median across all industries is 1.22% but some see as much as 3.57% percent engagement. So if you can generate anything over 1%, you’re golden.
Psst: Get Instagram growth hacks to get more followers (and increase engagement) here.
How to Check Engagement on TwitterTwitter can be an excellent tool for promoting your small business and nurturing relationships with your audience. To see your engagement on Twitter:

Image Source
Here you’ll see impressions, engagement, and the engagement rate for each tweet. In general, a good Twitter engagement rate is between 0.5 and 2.0%.
Pay attention to the tweets with the highest engagement rates to understand which messages resonate most with your followers. Also, take note of impressions and calculate the percentage of your audience who see your tweets. If it’s lower than 30%, you might try tweaking and re-tweeting to reach more people.
How to Check Engagement on LinkedInLastly, there’s the world’s largest professional network — LinkedIn. How can you check your engagement on this platform?
Image Source
What’s a good engagement rate for LinkedIn? Stats suggest that company updates see an average engagement rate of around 0.54% so you’ll want to be somewhere in that ballpark.
Related: Find out how to create a great LinkedIn Company Page.
7 Ways to Improve Social Media Engagement
So you’ve checked your engagement rates and familiarized yourself with the analytics available on your social media profiles. Great — but don’t stop there! Whether you’re getting next to no engagement or a decent amount, there’s always room for improvement.
What does that improvement involve? Definitely not spamming people’s feeds in an attempt to attract more attention to your business.
Consider seven powerful (and non-intrusive) methods for boosting your social media engagement levels.
1. Promote Your Social Accounts EverywhereYour efforts to boost engagement don’t have to be limited to social itself; in fact, they shouldn’t be limited to just your social channels. Display your social media info on your website and blog to encourage people to follow and connect with you.
If you have a physical location, have your handles displayed there also. You could place them on your business cards near the checkout, on your daily specials chalkboard, on your menus, etc. The more prominently you feature your social info and the more awareness you generate, the greater the chances of increased engagement.
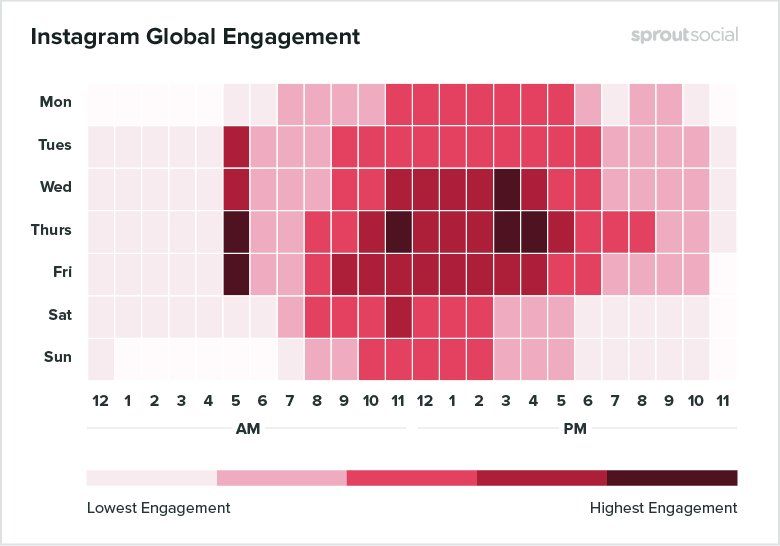
2. Pick Posting Times StrategicallyVarious factors influence the percentage of your audience that sees your content including your time zone vs. theirs and the social networks you post to. In turn, these factors influence the amount of engagement you see.
Image Source
Yet, things aren’t completely out of your hands. Not only are there guides on the best times to post, but you also have your own analytics to rely on. Use them both to narrow down the time slots that work best for your business.
3. Engage With Those Who Engage With You
Remember that high-quality, meaningful social media engagement is a two-way street. When people like or share your posts, comment, mention you, or use your hashtags, respond. Acknowledge the actions they take. It may move them and others to interact with you on social media even more in the future.
Additionally, it’s beneficial to engage with other accounts even when they don’t engage with you first. Liking, commenting on, and sharing others’ content can draw attention to your business, expand your audience, and, more importantly, foster new relationships.
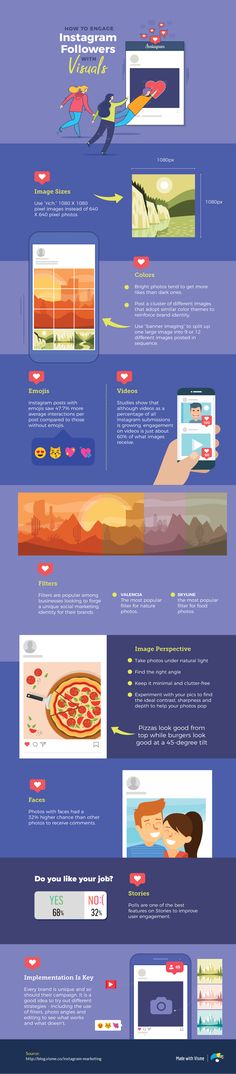
4. Share Visual ContentOne study showed that Facebook ads with images are more effective. How effective? Between 75 and 90% more! And the power of using visuals isn’t limited solely to Facebook. It’s been proven time and time again that in general people respond faster and better to visual information. Use this to your advantage by incorporating visuals into your social media marketing campaigns.
Image Source
You might use behind-the-scenes videos, team photos, infographics, etc. It doesn’t hurt to test various visual content types to see what resonates with your audience and boosts your engagement the most.
5. Create Emotional ContentHumans are primarily driven by emotion. Some research suggests that as little as 20% of our decisions are based on logic with a whopping 80% being based on emotion. The point? To consistently drive your audience to interact with you on social media, your posts must consistently appeal to emotion.
How can you do this? Content that sparks joy or that’s humorous, amusing, or inspirational tends to perform well. You can also leverage other emotions such as surprise, empathy, sadness, and even anger to capture the interest of your audience and prompt them to take action.
6. Highlight Offer & PromotionsPost promotions to your social media profiles to remind your customers of the deals and specials you’re offering.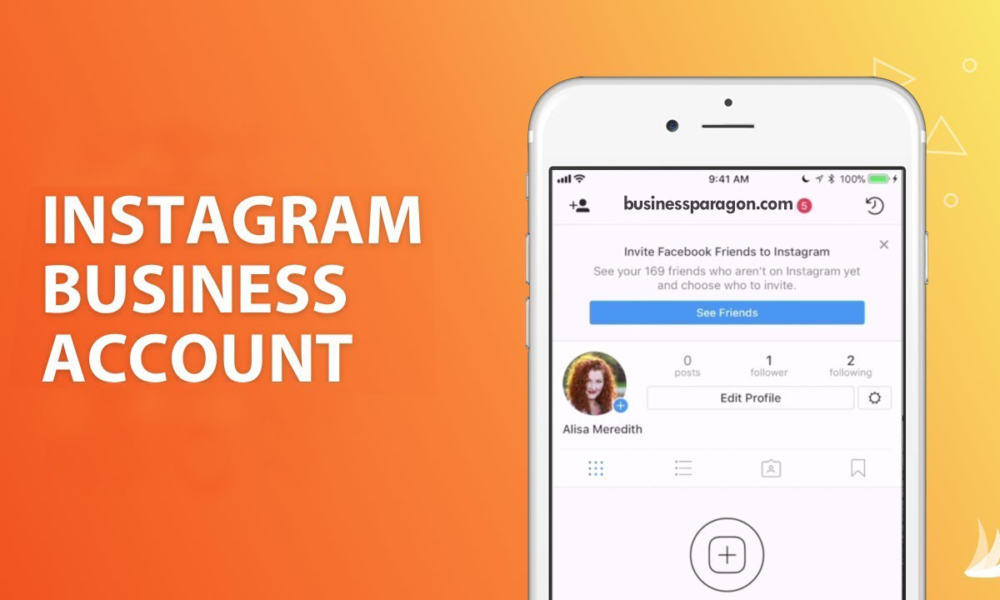 You could highlight a flash sale, your loyalty program, perks like free shipping, and so on. The options are endless and the results rewarding.
After all, people love promos and discounts, and they love talking about their promos and discounts. If you regularly highlight your most exciting offers, you can both boost engagement with your existing audience and expand your reach as they engage with your posts and create their own user-generated content (UGC).
7. Create Branded HashtagsSpeaking of user-generated content, you can encourage your followers to share it by creating a branded hashtag. Then, encourage people to include it in their posts related to your business, which will broaden your reach.
Footwear brand Allbirds is an excellent example of this, raking in over 12,000 user-generated posts on Instagram by encouraging the use of its hashtag #weareallbirds.
Image Source
For an even more powerful effect, feature the top posts generated by your audience on your account. It will reward those you featured for their engagement, encourage them to interact further, and encourage others to submit UGC as well for a chance to be showcased by you.
Besides hashtags, you can employ similar strategies by asking your audience to @mention you in their posts, tag your location, and use other popular hashtags such as #photooftheday. All of these methods can create positive buzz about your business and equate to letting your audience do your marketing for you! It’s just a matter of making engagement with your business a positive and rewarding experience for them.
Focus on Engagement for a Healthy Social Media Strategy
Keep in mind that social media marketing is more than posting to social channels; it also involves promoting engagement and being engaged. And the benefits of this big-picture strategy are huge. You can expand your marketing and advertising reach significantly, improve the quality of your audience, and amass a ton of social proof, all of which contribute to new and repeat business.
That said, you’d be wise to look over your social media analytics, make note of what’s worked for you and what hasn’t, and determine which of the seven engagement-boosting tips would be worth trying as part of your social media marketing strategy.
.
Instagram account statistics could only be viewed using third-party services and programs, but now it can be done in your own account and even from a computer to Facebook in Creator Studio. Where is this statistics and how to do it on Android and iPhone?
Instagram statistics for the account as a whole, individual publications and Stories can be viewed for free, but first you need to create a business account or an author account. nine0003
👉 How to make a business account on Instagram
You will get statistics of the photo and the whole account after switching to a business profile or author account . You can do this for free. Previously, it was necessary to link the Facebook page. But now this can not be done.
But in order to run ads directly in the application, Facebook still has to be linked. To do this, you need to remember your e-mail and password from your Facebook account, as well as create a public page for your business account. nine0003
After transferring to a business account or an author account, you will see the inscription “View professional panel” and the “Statistics” button at the top.
If you immediately click the button, then you will immediately go to the Statistics of your Instagram profile.
If you click "View professional panel" - then you can see all the tools for working with a business account / author account. Including there will be a line "all statistics". nine0003
The third way to view Instagram statistics - in your account, click the three bars on the top right and select "Statistics"
Instagram account statistics can only be viewed from the current moment. Everything that happened before, no one will ever know =) Therefore, you will see some intelligible statistics for the entire account within a week, and only new posts will have photo and video statistics.
Statistics are needed not only to track the progress of an account, but also for potential advertisers who ask for the Reach and Engagement of an account before buying an ad. What does Instagram stats mean?
On the main screen, you can select the period from the top - statistics for the last 7 days or 30 days.
Accounts Reached - is the total number of people who saw your posts, Stories and IGTV) in a week, plus a comparison with last week. It differs from Impressions in that here each person (account) is counted only once, even if he watched your posts several times. Therefore, Reach will always be less than Impressions. nine0003
👉 Instagram reach: what is it and how to increase it?
Click on Covered accounts and more detailed statistics will open.
Subscribers and everyone else (by reach) - how many of the audience covered were subscribed to you, and how many were not.
Content type - which content received the most coverage (also broken down by subscribers and unsubscribers)
Here you can also see which posts were the most popular in terms of reach. And if you press the triangle bracket 9 on the right0013 > , then you can filter statistics on Instagram by other indicators (comments, likes, subscriptions, etc.).
Impressions is the total number of content views. One person could watch several times, different content. Therefore, impressions are always more reach.
Actions in the profile are visits to your Instagram account plus clicks on the buttons in the account header (email, store, phone, etc. ).
).
YOUR AUDIENCE
Return to the first Instagram Insights screen. In the Your Audience section, click the triangle bracket on the right > . Statistics on subscriptions and unsubscribes on Instagram will open.
Increase - on this graph you will see the number of subscribers, unsubscribers and total (subscriptions minus unsubscribes).
Below are statistics by location, age and gender.
Peak periods - time (days and hours) when followers were most often on Instagram.
CONTENT YOU POSTED
Go back to the first Instagram Statistics screen. In the "Content you've posted" section, you'll see the number of posts/Stories/IGTV/Promotions in the last 7 or 30 days (depending on the filter on the top left). For each type of content, you can filter by all engagement indicators (impressions/reach/likes (likes)/comments/saves). nine0003
This will help you better understand the results of advertising from bloggers or giveaways. But this is only available for profiles with more than 10,000 subscribers. You can wind them up and go to the author’s account, especially if you don’t have enough 1000 subscribers and can’t wait to get new statistics right now. This will not hit the account engagement much. But ideally, of course, you need to grow organically, with the help of advertising from bloggers and targeting.
To find out the statistics of views (and not only) of each publication - photo or video on Instagram, you need to open the desired post and click "Statistics".
The top line of statistics is the number of likes, comments (👉 Comments on Instagram: how to talk subscribers), transfers to Direct and saves.
Saves - how many times the "save" button was pressed.
Visits to profile - how many times they went to the account from this photo.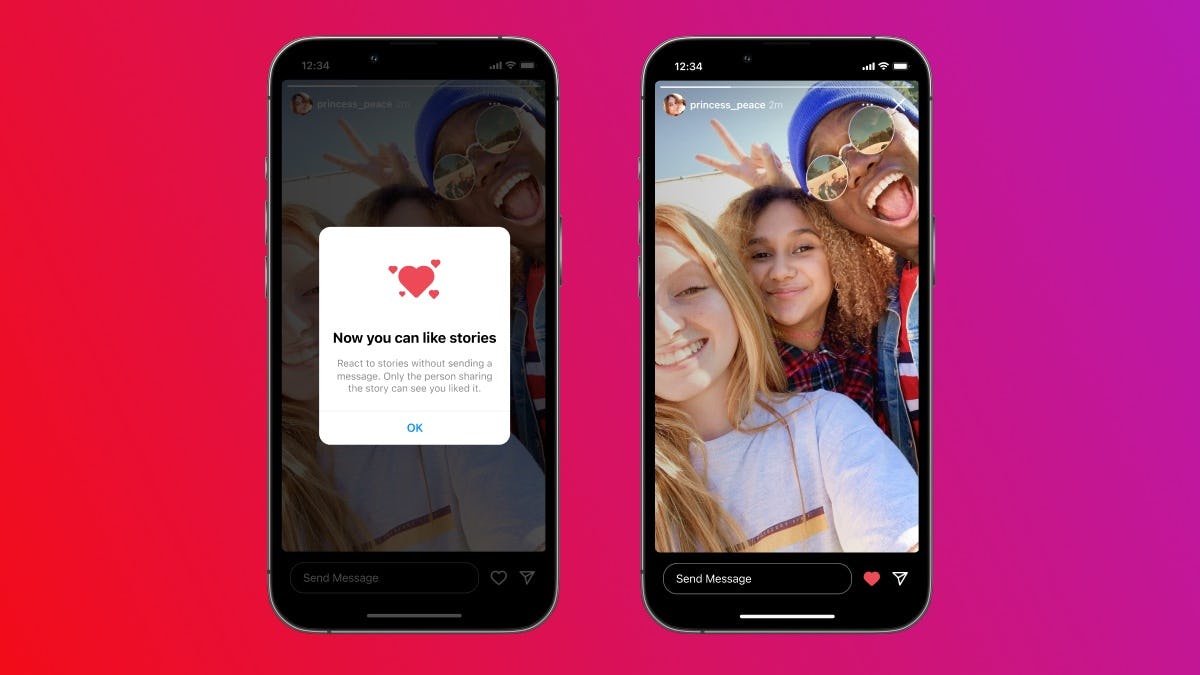 nine0003
Reach - how many people viewed the photo. On average, there should be 30-60% of subscribers. Less - a lot of bots that do not look at posts. More — if you ran an ad, got featured, the post turned out to be very popular, it was shared, etc. The larger your account, the smaller the reach in % of subscribers. Old followers abandon accounts or lose interest. This is fine. The highest coverage (in % of subscribers) is for accounts with up to 1000 subscribers. To increase your reach, be sure to post regularly, with a content plan. Even according to the coverage statistics on Instagram, you can understand whether you published a post at the right time or not. nine0003
If you swipe up on these statistics on Instagram, you can find out even more interesting things about the statistics of the post.
Profile visits - how many people went to your account after seeing this post
Reach - how many people saw your post.
Impressions - how many times your post was viewed. One person can view multiple times, so impressions are always more than reach.
From main page - how many people saw the post in the feed
From "Interesting" - views from the recommended tab, with a magnifying glass. The more, the more likely that the post has become "viral" (it is sent to friends, it appeared in the recommended). Also, a large percentage happens if you promoted a post.
From profile — how many people saw the post by logging into your account
From hashtags — how many came from hashtags
From “other” - all other sources
In a personal account, you can only see the total number and accounts of those who saw your Stories. To do this, swipe up from the bottom of any Story on Instagram.
After switching to a business or author account, you will have detailed statistics for each Instagram Stories. What does each statistic mean?
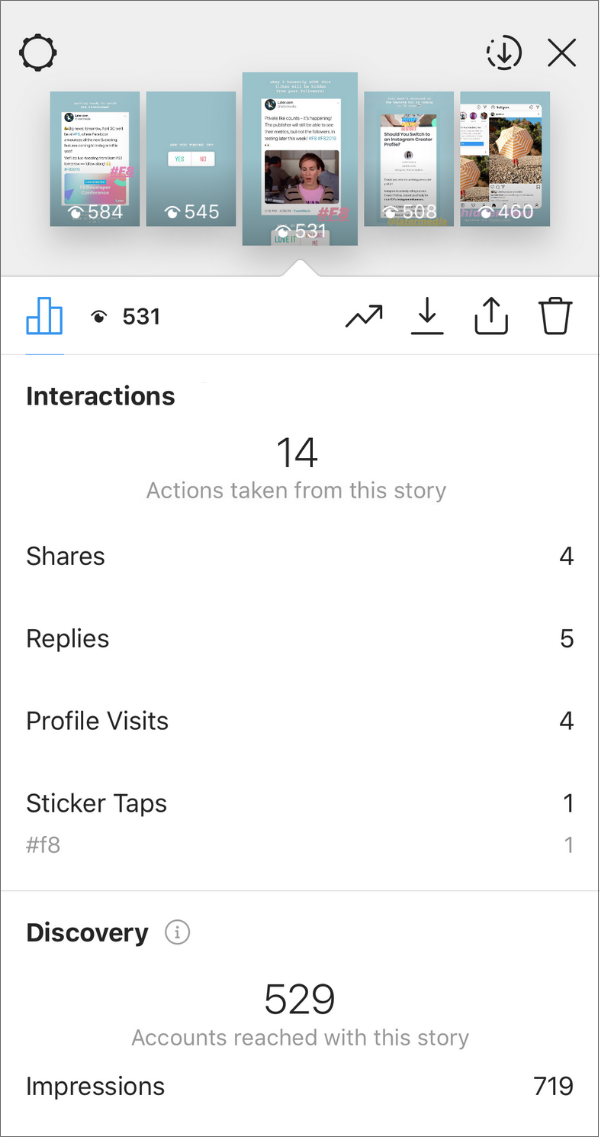
INTERACTIONS
Total statistics on the number of reactions to your Stories:
Replies — how many people answered you in Direct on this Story
Clicks on the link — how many times after this Story they went to your account and clicked on the link in the description.
Visits to profile - how many times after this Story they went to your account.
REACH STATISTICS
Here you will see statistics on how many people see your Stories and how they find them:
Accounts covered by this Story (Reach) - total number of people who saw this Story
Impressions - how many times this Story was viewed .
Subscriptions — how many subscriptions after this Story.
Navigation = back + scroll forward + jumps to next Story + exits0003
Forward - Number of taps forward to view your next Story
Next Story - Number of scrolls to the next account's Stories. Here you can understand whether was interesting or not was History , whether a person wanted to watch your content further or moved to the next account.
Exits — number of exits from the Stories view mode. Again, you can see the statistics of how the Story was able to keep the attention of subscribers. nine0003
Do not draw conclusions after the first week, how to connect free statistics on Instagram. Check how it will change for at least a month. Compare weekdays, weekends and holidays, good/bad weather outside.
Don't be in a hurry to "give it all away" if your coverage dropped in late spring and summer. Previously, no one had such statistics, and people who do not know the general trends in social networks and the Internet are afraid of fluctuations in statistics in their Instagram account. In the fall and after the New Year holidays, there is always an increase, and in the spring and summer there is an outflow. Of course, this does not apply to "seasonal" businesses (spring-summer travel agencies have growth, for example). nine0003
Even though many of us have a smartphone as an extension of our hand, we still scroll through Instagram less when we are on vacation, it’s summer outside, etc. Therefore, do not rush to arrange another giveaway or pour extra money on advertising if your coverage decline is seasonal. But do not abandon your account, if necessary, make pending posts for the holidays. Then even if you yourself are resting, you will still flicker in the feed of subscribers.
You will have the most reliable statistics a year after you make it. Therefore, it is best if you monitor your indicators on Instagram and write them down separately, noting what you did - cheating, advertising with bloggers, advertising (targeting), other promotion methods. nine0003
How did followers come across your account? What posts do they most often save, which ones do they forward to friends, after which ones do they most often decide to call or write? What cities do they live in? How old are they? What days of the week and what time of day are they most active on Instagram?
Statistics Instagram allows you to find out this most valuable information and, thanks to it, work more accurately with your audience and increase sales. nine0003
To access statistics, you need to switch your account to a business profile. Click on the menu (horizontal bars) in the upper right corner, select from the list "Settings" , then "Account" and "Switch to a professional account" .
More on this: "How to create a business account on Instagram."
Statistics will be collected from the moment you switched. nine0003
Now under each post we have a sentence "View statistics" . By clicking on it, we see several numbers.
We had information about the number of likes and comments before. But now we also have "airplane" - the number below it shows how many times your publication was sent to direct to other people. And also "flag" - it signals how many times your post has been saved.
"Profile visits - 9» . What do these words and numbers mean? The fact that 9 people who viewed the publication wanted to go to your profile.
Is it good or bad?
It may be different. This could mean that your subscriber thought:
“Wow, what a great post. I really wanted to buy from them. I’ll go see what kind of company this is, maybe I’ll ask them a couple of questions about the product.”
Or vice versa:
“Who wrote such nonsense? When did I manage to subscribe to this? What for? I’ll go look at their profile, maybe I’ll remember why I signed up, if this is not something promising in the future, I’ll unsubscribe as soon as possible. nine0003
It shows how many people actually saw your post. For some, this figure may be shocking. Did you think that you have 10 thousand subscribers, and statistics show that each of your posts is seen by no more than 1 thousand people? Yes, it happens, and very often. Coverage from 30% to 60% is a good indicator for commercial accounts, 10% -15% is very common. nine0003
By swiping up on (i.e. tapping the stats with your finger and swiping up the screen), we see more stats.
"Subscriptions - 2". This entry indicates that two people who saw your post decided to follow your account. That is, they were not subscribers before. How do you know how they came across your post? The answer may be further. nine0003
"Scope - 1026" . The post was seen by 1026 people, we have already talked about this. Curiously, more than half of these people (52%) were not our subscribers. How did they see our post? We will also look for the answer to this question in the following data.
Impressions - 1597 . This entry means that the post was shown 1597 times. And Reach showed that our post was seen by 1,021 people – a lot less. How can this be? Very simple. The number of impressions is almost always greater than the reach, which means that part of the subscribers saw your post two or more times. nine0003
"From the Main - 770" . That is, 770 people saw your post just in their feed. These are your followers.
"From hashtags - 582" . 582 people came across this post thanks to hashtags. Here is a possible answer to the question of how 52% of people who were not our subscribers found our post, and where these two new subscribers came from. All of them came to you by hashtag, and two of them became interested in the account and stayed. Unfortunately, this cannot be said for sure, we can only guess by comparing the data on hashtags, subscriptions and the number of people reached who were not subscribed to you before. nine0003
"From profile - 7" . These seven first came to the main page of your account, and from there they already went to the post. In what cases does this happen? For example, another Instagram account linked to you, people came to your main page, and from there they went to the post. Either the link to Instagram was on your website, or customers saw the name of your account in the office. There may be many options. The main thing is that people first went to the profile, and then they came to this particular publication.
"From Another - 240" . This line tells you the number of people who came to your post from other sources. For example, someone sent them a link to this post in Direct or shared it in another way (in an email, via messengers, on a website), or your post was saved, and then they looked at it again, and this re-view was counted in the line " From the Other."
This way we can see the statistics of any post that was published after switching to a business profile. nine0003
We also have the opportunity to find out the statistics of the account as a whole.
To see the account statistics, we again need to go to the menu (horizontal bars in the upper right corner) and click on the line "Statistics" .
Here we see tabs "Content" , "Actions" and "Audience" .
In this tab, by default, we are shown our posts and stories sorted by reach. First, the most popular - that is, those who received the largest coverage, and then in descending order. nine0003
We are also told how many posts and stories we had in total in the last week (45) and how this compares to the previous week (5 more).
We can sort both posts and stories by different parameters and for different periods. By clicking on the button " All ", we get the opportunity to select posts with the most likes - for this we need to select the line with the word "Like marks" . Or the one with the most comments. Or separate those posts, after viewing which readers started calling you - for this you need to select "Calls" . Or the ones that reposted the most.
You can also see the most successful posts by the sum of all these indicators - likes, comments, calls. To do this, select the first line - "Involvement" .
We can also make a selection for different periods - a maximum of 2 years, a minimum of 7 days. And see separately the comparative indicators of photo posts, video posts, carousels.
The same with stories. We can sort them by ostentatious indicators - "reach", "clicks to the site", "calls" and others, and also make a selection for different periods, but the maximum possible period in the case of stories is 14 days. nine0003
In this tab, you can see how reach, impressions, and other important indicators have varied over the past week - the number of visits to the profile, clicks on the site, clicks on the "Getting Directed" button.
Explore shows our total reach and impressions for the last week.
We see that the coverage was 3854 people, and it is very much reduced compared to the previous week. nine0003
Total impressions - 17698 people, and also a noticeable decrease compared to the previous period.
Also on the graph, we can see which days the coverage was more or less.
And by pointing a finger at this graph, we see specific figures - one and a half thousand coverage on Monday and Wednesday, almost the same on Tuesday, on other days much less.
In the "Interaction" block, you can see how many visits to the profile, clicks on the site from the profile, clicks on the button "How to get there". nine0003
We are also shown a graph of the distribution of this activity during the week. We see that the most actions were on Wednesday - 57 pieces.
To see specific figures, touch this graph with your finger.
In this tab, we can see how the number of your subscribers has changed over the past week, in which cities and countries your subscribers live, how old they are, what time they are most active.
This tab gives us information about the number of subscribers. In particular, about how many people have unsubscribed from us, how many have subscribed, and what the result is an increase - it can be positive and negative, when after all the subscriptions-unsubscribes, the number of subscribers has decreased.
In our example, 12 unsubscribed, 16 subscribed, the end result is plus 4 subscribers this week.
Below we see a graph of the number of subscribers. We see a failure on Saturday. We can press our finger on this failure, and we will be shown more detailed information about it. We see that on Saturday, December 7, three people unsubscribed from us and no one signed up. nine0003
And if we want to find out what kind of publications led to such a result, we can click on the button "View publications" and we will see just posts and stories for December 7-8 and statistics on them. In this way, you can understand which publications readers do not like. Although in our case the numbers are too small to speak of conclusions. Rather, they are within the bounds of statistical error.
Below we can see information about the cities in which our subscribers live. nine0003
As expected, the Moscow children's center, whose account we are considering, has the majority of subscribers from Moscow.
And by clicking on the button "Countries" , we will find out from which countries in what proportion we have subscribers. Also, most are expected from Russia, but there are also from Kazakhstan, the USA, Ukraine and even Brazil.
In the next section, we can see what age men and women are in our account.
We see that our subscribers are dominated by people aged 25 to 34 years, slightly less women and older men - from 35 to 44 years old. nine0003
Interestingly, our account is also followed by schoolchildren under the age of 17 and older people over 65. Where Instagram has gone!
Here we are shown that 71% of our subscribers are women, only 29% are men.
This section is called “Followers” for some reason, although it would be more correct to call it “Followers Activity”, because that is what it shows: at what time of the day and what days of the week your followers are most active on Instagram.