If you are a social media manager, you’ve likely looked at ‘best time to post on social media’ studies to come up with several posting times for your brand.
I know I have.
But now, I believe it’s time to reconsider these studies.
In the last few years, more and more studies on the best times to post have been released. (At Buffer, we contributed to this too!) And while knowing your best time to post is still very relevant, I’m starting to feel that it’s no longer useful to refer to studies on this topic.
Bad insights can drive poor decision-making and simply going with the best time to post from a study could hinder your marketing efforts rather than help.
Read on to find out what you should do instead…
The concept of ‘best time to post on social media’ is still very much relevant.
Even with social media algorithms, it’s important to get engagement within the first few hours of posting so that the algorithms will show your posts to more of your audience. And finding the right times to post for your brand can help with that.
But I think it’s time we shift our focus away from studies on the best time to post on social media. While the studies are well-intended, they (including ours) are flawed in several ways.
Many of these studies suggest best times to post based on aggregated data. The challenge with this is that the data includes businesses and individuals from different locations and different industries while your audience is unique to you. It’s hard to say that the average best time to post for a wide range of businesses would apply to your business.
Here are two good examples by Matt Rhodes from his article, The danger of bad insights and poor digital marketing decisions:
For a brand targeting mums, for example, it may make more sense to create engaging content at 2am when mums are awake and alone with their babies. For a brand targeting football fans, as another example, your research may find that your audience most wants to engage after football matches in the afternoon or evening.
We are guilty of this at Buffer. Our best time to tweet study was done in 2016. Another guide on best times that we compiled was done in 2013!
As social media usage has likely changed over the last few years, the information in these posts might not be that useful now.
It’s also good to note that “newer” studies that were published recently could be referring to much older studies. So it’ll be great to check the primary source of the data before taking the recommendations.
Does this mean that those studies are not useful at all? Not entirely.
They can serve as a great starting point, especially if they suggest plausible explanations for those best times to post. For example, if you are working on an entirely new social media profile and do not have any data of your own to work with, some studies can come in handy. But they are not a copy-and-paste blueprint for success.
Try to go beyond just taking the “best times” from the studies and understand why those could be great times to post. Perhaps it’s because people are using Facebook while commuting to work. Or maybe it’s because teenagers are scrolling through Instagram late at night before they sleep.
And they are just that — a starting point.
What’s more important is to gain a better understanding of your brand’s unique audience such as their social media usage patterns. Let’s go through how to find your best time to post on social media while learning about your audience!
Social media is becoming increasingly personalized. From being a broadcasting channel, social media is becoming a one-to-one and one-to-few engagement channel.
To provide a personalized experience to your brand’s followers, you need to post according to your audience’s social media usage behavior. When done right, there’s a higher chance of them seeing and engaging with your social media posts — more reach and more engagement!
Here’s how to find your own best time to post on social media:
This new feature in Analyze will allow you to skip all the steps below.
You can now get three personalized recommendations on when to post on Instagram to maximize your reach for the week. If you want more great times to post, you can dive into the chart and look for other times with above-average hourly reach.
Your reach is predicted using data from your previous posts and your followers’ activity. It is unique and personalized for your brand.
This feature is currently available for Instagram Business profiles only. For other social media channels, check out the steps below.
The approach that we’ll be going through below depends on your previous posts. Even if it’s your first social media manager job, the brand probably has some data for you to work with if they have posted before.
If you are taking on a brand new social media profile, don’t worry. You can start with a few informed guesses. Think logically about when your audience might be online and interacting with your social media posts. (Or some of the better studies could be useful. )
)
Here are some possibilities:
If you know your target audience and their rough location, you could use that information to strengthen your hypotheses. For example, if you are a local business in Singapore, you might want to focus on times when people in Singapore are awake.
Once you have a handful of informed guesses, it’s time to test them!
To effectively test your guesses, you would want to post at those particular times a few times. With Publish’s custom posting schedule, you can easily experiment with the times over a period of a few weeks (or more).
Here’s how the posting schedule works: After you set up your posting schedule with several times, every social media post that you “Add to Queue” will fill up the next available time slot in your schedule (or “Buffer queue”).
To create or change your posting schedule, select your desired social account and click on “Settings”, then “Posting Schedule”.
Here are the quick steps to adding a new posting time:
If you want to edit a time in your schedule, simply click on it.
To delete a time in your schedule, hover over the time and click on the cross that would appear on its right.
Note: Your posting schedule is unique to each connected social account. Adding a new posting time to one social account’s schedule does not apply it to all your connected social accounts.
You could schedule a few weeks’ of social media posts all at a go or do it on a weekly basis. Up to you!
This is not truly scientific but three to four weeks of posting would usually give you enough data to work with and find your best times.
What you should be posting can be a blog post on its own (or several blog posts) so I’ll not cover this here. If you would like some reading resources, here are some of our blog posts on content creation:
To schedule your social media posts with Publish, click on the composer (“What do you want to share?”) in your dashboard. In the composer, select the social media accounts you want to share to and add your text, link, or multimedia. When you hit “Add to Queue”, that post will fill up the next available slot in your posting schedule (or “Buffer queue”).
Pro tip: When composing a scheduled Instagram post, you can add hashtags as your first comment, include a link to your website, and add your location.
Once you have a few weeks’ worth of data, you can start to analyze your results.
In your Analyze dashboard, select your preferred social media account and click on “Posts”. (If you are not using Buffer, here are some other ideas!)
To find out the best times to post for your social media account, sort your posts by your desired metric, such as likes, impressions, or engagement rate. Then see when the top posts were published or if any times keep coming up for your top posts. Note down the times. These are your current best times to post.
By now, you should have a good sense of the good and bad times.
Go back to your posting schedule in your Publish dashboard and update it. Keep the good posting times, delete the bad ones, and add a few more experimental times.
(And repeat all the steps!)
How many posting times should you keep and how many to delete? It depends. And this isn’t very scientific: for a start, you could keep half of the posting times and change the remaining half. Once you have run a few rounds of tests and are more certain about your best times to post, you could keep to an 80/20 ratio — 80 percent tested times / 20 percent experimental times.
Your best time to post could be always changing as your following grows. It might not change, too. If you’re comfortable, you could only re-run this timing experiment every quarter or half a year.
Pro tip: By now, you likely have some followers data in your native analytics such as Facebook Insights. Use the information (e.g. top follower locations, demographics, interests) to come up with more educated guesses (as per step 1 above).
Check out these articles:
 ..
..That’s cool! The native analytics on social media platforms and some free tools can provide you with helpful data for finding your best times to post.
In your Facebook Page Insights, under the Post tab, there’s a section at the top called When Your Fans Are Online. It tells you the number of fans who were online on each day and each hour of the past week.
With this data, you can then come up with a few times to test. For example, our Facebook fans seem to mostly online between 9am and 1pm ET so we could test a few times within that range.
If you have a business profile on Instagram, you will have data similar to your Facebook Insights in your Instagram Insights. Look for the Audience section in your Instagram Insights to see the days and hours when your followers are most active.
Just like for Facebook, experiment with a few times when your Instagram followers are most active.
While Twitter doesn’t provide the same follower data, Followerwonk (by Moz) does! When you sign up for a free account with your Twitter account, you get to analyze accounts with up to one million followers.
Finding your best time to post on LinkedIn and Pinterest is a bit more tricky. Neither LinkedIn nor Pinterest shares follower activity data like Facebook and Instagram. (If you know of a tool like Follwerwonk but for LinkedIn or Pinterest, please let me know.)
But no worries at all! With a combination of a spreadsheet and their native analytics, you can still find your best time to post on these platforms.

While I still think posting times are important for reach and engagement, I personally feel that we marketers have unintentionally put more emphasis on “best times to post on social media” studies than doing our own experimentation. Instead of getting recommendations from the studies, we might be much better off running our own best time experiments.
That’s because every brand has a unique audience. Your audience is likely made up of mostly your customers and your fans while other brands’ audience is made of theirs. What works for other brands might not work for you so it’s important to do your own experimentations to find your best time to post on social media.
Brought to you by
Get started for free now
There are many factors to success on Instagram. One of the most important is timing. In this guide, we'll walk you through a step-by-step process to help you find the best times for your business to post
You might have heard that the best time to post on Instagram is 11 a.m. to 1 p.m. Or maybe 2 to 3 p.m. And that you should avoid Mondays and weekends, and post more on Thursdays...
Well, here's the truth.
There’s no one-size-fits-all best time to post on Instagram. All those studies that looked at millions of users? Not all that helpful. Those aren’t your followers.
So, buckle up—we’re here to show you how to find the best time to post on Instagram for your business.
💡
Schedule your Instagram posts, carousels, stories, and reels with Buffer
Visually plan your content calendar and make your profile a "must-follow" with Buffer's suite of Instagram scheduling and analytics tools.
The best time to post on Instagram is when your audience is most active. But it may also be a time when fewer followers are online—if your content is relevant to their daily routine at that moment.
Both timeliness and relevance are factors that the Instagram algorithm uses to determine where your post falls within your followers’ feeds. And the higher your posts show in your followers’ feeds, the more impressions your brand gains. More impressions can lead to more engagement. And the more engagement your posts get, the more impressions your future posts can get, too, creating a snowball effect.
Posting at the time when most of your followers are active will give your post a better chance of being seen by more people. This is due to the timeliness or recency factor, which simply means that your post occurs close to the time that a user logs on.
Emma Ward, marketing manager for the New England smoothie bar The Juicery, has Instagram scheduling down to a science. She reserves the time when most of The Juicery’s followers are on Instagram to post about promotions, news, or other exciting content to share.
“If I’m promoting a giveaway, a new location, or something that isn’t menu-specific, I’ll post in the evenings. I want to get the most eyes on the content and, therefore, post at a time where the most amount of people are online,” she tells us.
The Juicery posts non-menu content in the evenings to reach more of its 10k+ followers.While most of her brand’s followers are online in the evenings, she knows that’s hardly the time when people are primed to buy smoothies, though. Thus, the optimal time to post to Instagram depends on the content you have to share, too.
The Instagram algorithm seeks to first show users the content they want to see most. How does it know what people want to see? By looking at users’ interests and relationships. The more relevant your content is to your followers, the more they’ll interact with it. This engagement prompts Instagram to display your content higher on people’s feeds.
Emma considers when her brand’s products are most relevant to its followers’ daily schedules. For The Juicery, mornings are a great time to get in front of people who are thinking about what to pick up for breakfast. She posts about smoothies and other menu items first thing in the morning—around 7:30 a.m. every weekday and just past 8 a.m. on the weekends, even if the number of followers online is smaller.
Emma says of her followers, “I want our smoothies to be on top of mind when they head into a workday. ”
”
If she simply looked to conventional “best time to post on Instagram” advice from aggregate studies, she would miss the opportunity to plant the idea of a morning smoothie for those followers who are most likely to go pick one up on their way to work.
Finding the best times to post on Instagram for your brand doesn’t have to be complicated. You’ll need to consider two things:
These two data points will give you an idea of your optimal posting times, which you can then test and refine.
Now let’s walk through each step to finding your best times to post together. (Buffer's analytics can also do the legwork and recommend best times for you, too. )
)
You can see when your greatest number of followers are on Instagram by looking at the insights that Instagram provides. You’ll find this information for business accounts by clicking the Insights button.
The Insights button is located on the business account profile page.Under Insights, you can then click to view data broken down by content, activity, and audience. Select the Audience tab to see data on your followers, including when they access Instagram, as well as their location, age range, and gender. You can toggle between hours and days to view their most active times.
Instagram Insights displays audience details for the previous seven days.Keep in mind that the data only shows for the past seven days in your Instagram account. This gives you limited data, but it’s a start. Watch out for the impact of special occasions and seasonal behavior before you base any decisions on data from such a short timeframe.
The best time to post one type of content on Instagram will differ from that for another. And chances are you have several different types of content you can serve up.
At this step, come up with a hypothesis. You know your target audience better than anyone else. What time of day are they dealing with the problem that you solve? When does it make sense for them to think of your brand?
Emma considers when each type of content will be most relevant for The Juicery’s followers, and then she tries it out. “For each new type of content, I’ll try it at different times. A post with an enticing acai bowl will be at a different time than a gift card giveaway,” she explains.
Now you know when your followers are online, and you have an idea of what content you think may interest them at those times. Try putting it into action with an Instagram posting schedule for a set period like three weeks.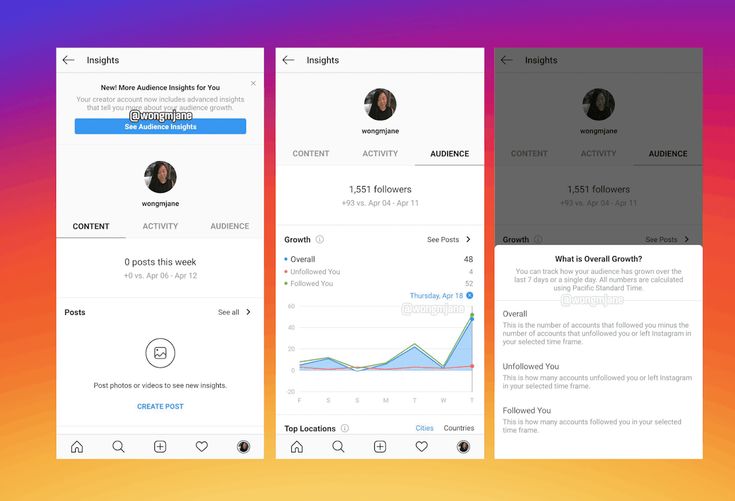
Let’s say you run the Instagram account for a gym. We’ve hypothesized some different types of content that we think might resonate with your followers at different points in their day.
The idea is to consider what time your followers want to hear from you. If you’re a gym, your followers might be looking for healthy inspiration in the afternoon when their energy is waning or in the morning when they face the choice to get out of bed and hit the gym rather than sleeping in. Reminding them of upcoming class schedules can help them plan for the next day. And perhaps you want to post content that encourages people to visit on Tuesdays and Thursdays since those days are often less busy at your gym.
You don’t have to publish a certain number of times a day. Once you find your optimal times, you may be able to publish less with greater impact. And remember, hashtags based on days of the week can be a powerful way to grow your following, too.
By the time you’ve come through a few weeks of testing your Instagram posting schedule, you’ll have an idea of which content is resonating with your followers at which times.
Then, you can tweak your schedule to refine it. Keep posting the content that resonates with followers, and change up the content that didn’t do as well.
Where can you find the data? Instagram shows engagement numbers for each post under the Posts tab in the Insights section of your business account.
Find engagement data under the Posts tab in your Instagram Insights.If you use Buffer’s analytics, you can find a goldmine of data organized in a way that’s easy to understand. For example, you can see the interactions for each post side by side to get a feel for how each resonated with your followers.
Buffer's analytics shows a wealth of information that you can customize to report on the metrics you want to see.In the Instagram example schedule promoting a gym, perhaps your early morning posts got likes and comments, but your late-afternoon posts didn’t resonate even though it was a time when a lot of your followers were online. You could try posting a different kind of content at that time to determine what your afternoon crowd responds to.
To dig deeper into data, check out Buffer’s Ultimate Guide to Instagram Analytics.
Your post performance data is based on your posting history. So check your best times every month or so, and try testing out new times occasionally. This lets you continue learning about your audience.
Laura Moss, co-founder of Adventure Cats, usually posts during the daytime, but she sometimes experiments with an evening or late-night post to see how it resonates with her brand’s 162k followers.
Occasionally her “experiments” happen organically because she forgets to schedule a post and ends up posting at a less-than-optimal time. She says, “Sometimes it’s a pleasant surprise to see that post take off, but other times it serves as a reminder that doing some strategic planning and scheduling is smart.”
Brands that schedule their posts can aim for specific times each day. However, Laura likes to post manually. She aims to post to Instagram between 10 a. m. and 3 p.m. on weekdays to get visibility.
If you miss posting at a certain time each day, does it mean your posts will be lost in your followers’ feeds? Not necessarily.
It’s true that analytics data pinpoints the best time of day to the hour, and consistently scheduling your posts is key to hitting your best time of day—every time—to maximize engagement. However, the time on either side of this precise point will often be very favorable, too. While not optimal, you could still see positive effects by publishing within a range, like Laura does.
When you’re operating a small business, your resources can be spread pretty thin. Your social media accounts are just one part of your marketing, and you need to approach everything efficiently. Taking advantage of the best time to post to Instagram for your business means you can see a bigger effect with less effort.
“The predictive ‘best time to post’ feature in Buffer's analytics is a game-changer!
Choosing the right tools can help stretch your marketing efforts further. Buffer’s tools can be found behind many successful Instagram marketers like Emma and Laura. Buffer’s analytics help you determine your best times to post, the best types of posts, and how often you should post to maximize reach and engagement. The tool studies your data over time to make informed recommendations and predict how your followers will respond.
In Emma’s words, “The predictive ‘best time to post’ feature in Buffer's analytics is a game-changer! Especially for my smaller accounts, I really look to this tool to see suggested times based on when our followers are online and when they’re engaged.”
Buffer's Answers feature uses data from your previous posts and followers' activity to calculate your best times to post.Buffer's Answers feature gives you three posting time suggestions for maximizing your reach on Instagram. Our in-house statistical model predicts your reach for every hour of the week based on your followers’ activity and the performance of your previous posts. Three times, spread across the entire week, are then recommended to you so that you can schedule your Instagram posts and maximize your reach.
So, instead of posting 20 times a week, you can optimize, say, five really great posts and see better results. We invite you to learn more in our Instagram marketing library and look into Buffer's analytics today.
Brought to you by
Get started for free now
How did followers come across your account? What posts do they most often save, which ones do they forward to friends, after which ones do they most often decide to call or write? What cities do they live in? How old are they? What days of the week and what time of day are they most active on Instagram?
Statistics Instagram allows you to find out this most valuable information and, thanks to it, work more accurately with your audience and increase sales.
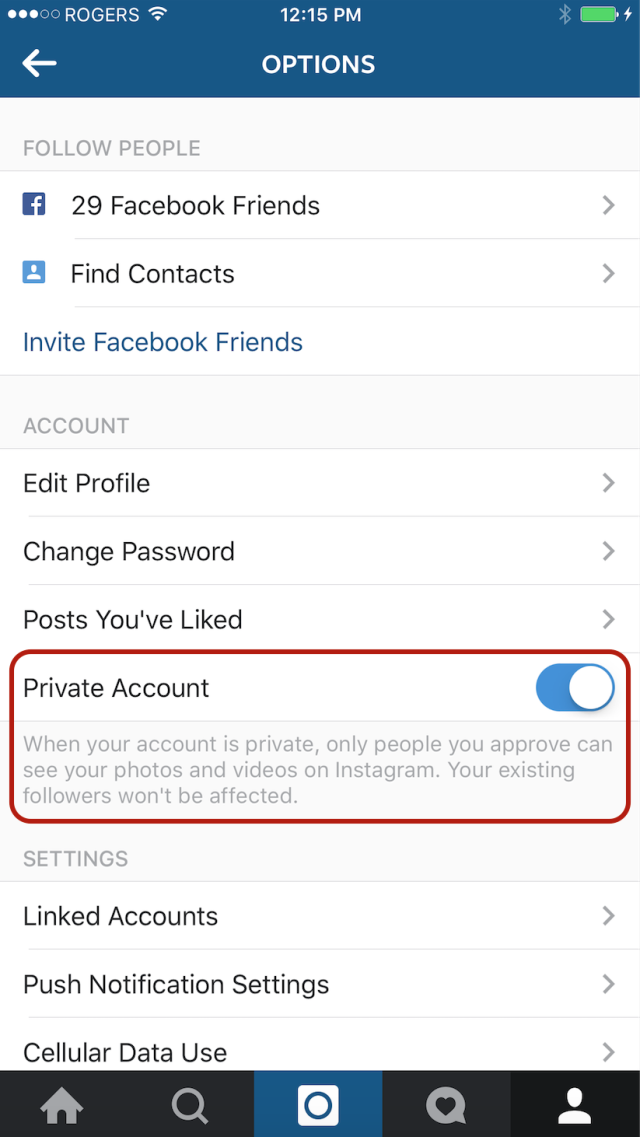
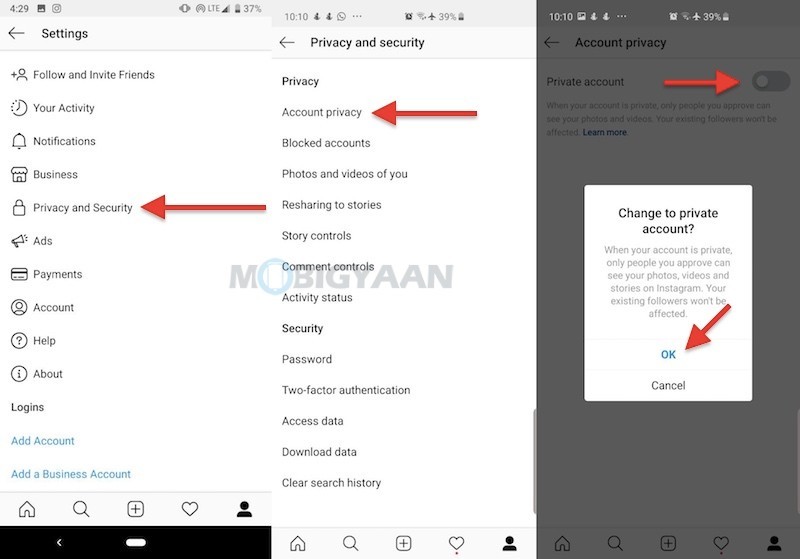
To access statistics, you need to switch your account to a business profile. Click on the menu (horizontal stripes) in the upper right corner, select from the list "Settings" , then "Account" and "Switch to a professional account" .
More on this: "How to create a business account on Instagram."
Statistics will be collected from the moment you switched.
Now under each post we have a sentence "View statistics" . By clicking on it, we see several numbers.
We had information about the number of likes and comments before. But now we also have "airplane" - the number below it shows how many times your publication was sent to direct to other people. And also "flag" - it signals how many times your post has been saved.
"Profile visits - 9» . What do these words and numbers mean? The fact that 9 people who viewed the publication wanted to go to your profile.
Is it good or bad?
It may be different. This could mean that your subscriber thought:
“Wow, what a great post. I really wanted to buy from them. I’ll go see what kind of company this is, maybe I’ll ask them a couple of questions about the product.”
Or vice versa:
“Who wrote such nonsense? When did I manage to subscribe to this? What for? I’ll go look at their profile, maybe I’ll remember why I signed up, if this is not something promising in the future, I’ll unsubscribe as soon as possible.
It shows how many people actually saw your post. For some, this figure may be shocking. Did you think that you have 10 thousand subscribers, and statistics show that each of your posts is seen by no more than 1 thousand people? Yes, it happens, and very often. Coverage from 30% to 60% is a good indicator for commercial accounts, 10% -15% is very common.
By "swiping up" (i.e. tapping the stats with your finger and dragging it up the screen), we see more stats.
"Subscriptions - 2". This entry indicates that two people who saw your post decided to follow your account. That is, they were not subscribers before. How do you know how they came across your post? The answer may be further.
"Scope - 1026" . The post was seen by 1026 people, we have already talked about this. Curiously, more than half of these people (52%) were not our subscribers. How did they see our post? We will also look for the answer to this question in the following data.
"Impressions - 1597" . This entry means that the post was shown 1597 times. And Reach showed that our post was seen by 1,021 people – a lot less. How can this be? Very simple. The number of impressions is almost always greater than the reach, which means that part of the subscribers saw your post two or more times.
"From the Main - 770" . That is, 770 people saw your post just in their feed. These are your followers.
"From hashtags - 582" . 582 people came across this post thanks to hashtags. Here is a possible answer to the question of how 52% of people who were not our subscribers found our post, and where these two new subscribers came from. All of them came to you by hashtag, and two of them became interested in the account and stayed. Unfortunately, this cannot be said for sure, we can only guess by comparing the data on hashtags, subscriptions and the number of people reached who were not subscribed to you before.
"From profile - 7" . These seven first came to the main page of your account, and from there they already went to the post. In what cases does this happen? For example, another Instagram account linked to you, people came to your main page, and from there they went to the post. Either the link to Instagram was on your website, or customers saw the name of your account in the office. There may be many options. The main thing is that people first went to the profile, and then they came to this particular publication.
"From Another - 240" . This line tells you the number of people who came to your post from other sources. For example, someone sent them a link to this post in Direct or shared it in another way (in an email, via messengers, on a website), or your post was saved, and then they looked at it again, and this re-view was counted in the line " From the Other."
This way we can see the statistics of any post that was published after switching to a business profile.
We also have the opportunity to find out the statistics of the account as a whole.
To see the account statistics, we again need to go to the menu (horizontal bars in the upper right corner) and click on the line "Statistics" .
Here we see tabs "Content" , "Actions" and "Audience" .
In this tab, by default, we are shown our posts and stories sorted by reach. First, the most popular - that is, those who received the largest coverage, and then in descending order.
We are also told how many posts and stories we had in total in the last week (45) and how this compares to the previous week (5 more).
We can sort both posts and stories by different parameters and for different periods. By clicking on the button " All ", we get the opportunity to select posts with the most likes - to do this, select the line with the word "Like marks" . Or the one with the most comments. Or separate those posts, after viewing which readers started calling you - for this you need to select "Calls" . Or the ones that reposted the most.
You can also see the most successful posts by the sum of all these indicators - likes, comments, calls. To do this, select the first line - "Involvement" .
We can also make a selection for different periods - a maximum of 2 years, a minimum of 7 days. And see separately the comparative indicators of photo posts, video posts, carousels.
The same with stories. We can sort them by ostentatious indicators - "reach", "clicks to the site", "calls" and others, and also make a selection for different periods, but the maximum possible period in the case of stories is 14 days.
In this tab, you can see how reach, impressions, and other important indicators have varied over the past week - the number of visits to the profile, clicks on the site, clicks on the "Getting Directed" button.
Featured shows our total reach and impressions for the last week.
We see that the coverage was 3854 people, and it is very much reduced compared to the previous week.
Total impressions - 17698 people, and also a noticeable decrease compared to the previous period.
Also on the graph, we can see which days the coverage was more or less.
And by pointing a finger at this graph, we see specific figures - one and a half thousand coverage on Monday and Wednesday, almost the same on Tuesday, on other days much less.
In the "Interaction" block, you can see how many visits to the profile, clicks on the site from the profile, clicks on the button "How to get there".
We are also shown a graph of the distribution of this activity during the week. We see that the most actions were on Wednesday - 57 pieces.
To see specific figures, touch this graph with your finger.
In this tab, we can see how the number of your subscribers has changed over the past week, in which cities and countries your subscribers live, how old they are, what time they are most active.
This tab gives us information about the number of subscribers. In particular, about how many people have unsubscribed from us, how many have subscribed, and what the result is an increase - it can be positive and negative, when after all the subscriptions-unsubscribes, the number of subscribers has decreased.
In our example, 12 unsubscribed, 16 subscribed, the final result is plus 4 subscribers this week.
Just below we see a graph of the number of subscribers. We see a failure on Saturday. We can press our finger on this failure, and we will be shown more detailed information about it. We see that on Saturday, December 7, three people unsubscribed from us and no one signed up.
And if we want to find out what kind of publications led to such a result, we can click on the button "View publications" and we will see just posts and stories for December 7-8 and statistics on them. In this way, you can understand which publications readers do not like. Although in our case the numbers are too small to speak of conclusions. Rather, they are within the bounds of statistical error.
Below we can see information about the cities in which our subscribers live.
As expected, the Moscow children's center, whose account we are considering, has the majority of subscribers from Moscow.
And by clicking on the button "Countries" , we will find out from which countries in what proportion we have subscribers. Also, most are expected from Russia, but there are also from Kazakhstan, the USA, Ukraine and even Brazil.
In the next section, we can see what age men and women are in our account.
We see that our subscribers are dominated by people aged 25 to 34 years, slightly less women and older men - from 35 to 44 years old.
Interestingly, our account is also followed by schoolchildren under the age of 17 and older people over 65. Where Instagram has gone!
Here we are shown that 71% of our subscribers are women, only 29% are men.
This section is called “Followers” for some reason, although it would be more correct to call it “Followers Activity”, because that is what it shows: at what time of the day and what days of the week your followers are most active on Instagram.
By clicking on the button "Days" , I see that the most intense color is on Monday, Tuesday and Wednesday. So, these days the audience is most active. The palest one is on Saturday, apparently on this day our subscribers take a break from gadgets.
With the button "Clock" you can view the activity by the clock. Expected little activity around 3-6 am, maximum activity around 6 pm.
So, we figured out what Instagram coverage is and why everyone is fighting so hard for it, how to see the place of residence and age of your subscribers, how you can really isolate the most effective publications.
I hope that this article will help you conduct high-quality analytics of your account and, thanks to it, work effectively with your subscribers and earn more.
Statistics is a tool for companies to get information about subscribers and what content they are most interested in.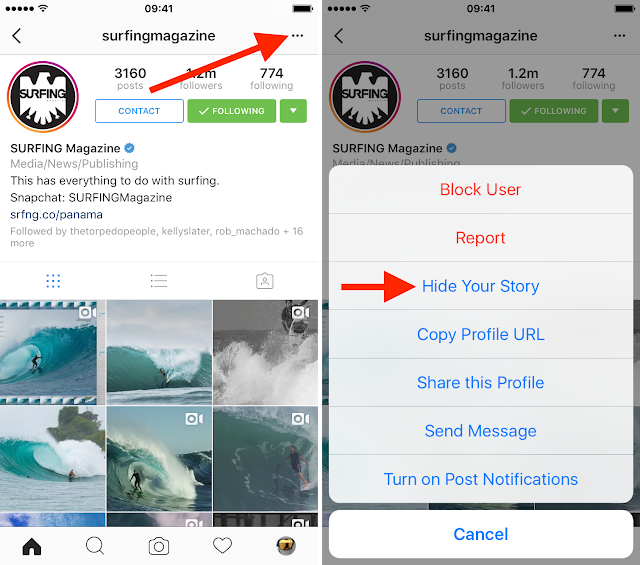 With it, you can better understand your audience and get all the information you need to create effective content.
With Instagram Insights, you can grow your reach, get the results you want, and build a community of people who care about your company.
This tool breaks down the demographics and user behavior data into three sections: Actions , Content and Audience .
Learn how people interact with your content
on the Section in section Information 0003

Find out how many people have seen your content
On the Actions tab in section Where to find content you will find the following information:
Use the metrics from the "Interactions" and "Where content is found" sections to schedule posts.
For example, if you reach more people on Tuesdays, your followers may be more active on that day. Post content related to your business on Tuesdays and you can increase the number of views and interactions with your company.
Find out how your posts, stories and promotions are performing.
The Content tab shows the performance of your posts, stories and promotions. You can filter the data shown by metric types, dates, and content types.
The metrics on the Content tab will help you understand which post formats resonate with your followers the most.
For example, if you see that your Instagram stories are getting more impressions on certain days than regular or boosted posts, then you should post more stories to your business account on those days.
Find out which people follow your business profile
The Audience tab provides detailed information about your subscribers. You can find out their gender and age, as well as find out in which regions your content is most popular. You'll also find out what time of day your followers usually log on to Instagram and what days of the week they're most active.
Note. For demographic metrics (such as people's age and gender) to be available to you, your business Instagram account must have at least 100 followers.
Use audience metrics to create content that is relevant to your followers
For example, if the majority of your followers are between 25 and 34 years old, you'd better post content that is appropriate for that age group.
Stats are available in your account and in the individual posts you create.
To access it, you must meet the following requirements: