How to check the number of views on facebook
How To See How Many Views on Facebook Post
FacebookSocial Media
By Richard Hebert September 29, 2022September 29, 2022
Facebook has become a social platform where you can build a community of followers for your brand, product, or discipline. As long as you have a page and have signed up with Facebook business managers, you get access to metrics that lets you build your page better and reach an even wider audience. For example, with these metrics, you can see how many views you have on a Facebook post.
In this article, we’ll see how you can check your post views on Facebook from your page or group.
Table of Contents
- Insights And Metrics on Your Facebook Posts
- How To Check How Many Views You Have on Your Facebook Post
- How To Get More Insights From Facebook on a Post
- How To Check How Many People Liked/Dislike Your Facebook Post
- Conclusion
Insights And Metrics on Your Facebook Posts
Since its inception as an individual user, Facebook has aimed to connect you with family and friends. And you can do this without worrying about who your posts reach and how you can make them better. The same applies today, but the social platform has evolved significantly to accommodate businesses, brands, and public figures.
These businesses, brands, and public figures are primarily on Facebook to amplify their reach. And with this aim comes the need for metrics provided by Facebook on how their followers interact with their content. Hence, insights and metrics can only be obtained from a Facebook post made by an admin of a Facebook page.
Not only do admins have access to these insights, but editors, analysts, moderators, and job managers also. Hence if you weren’t on a Facebook page before and want to check the views on a Facebook post, you only need to be assigned one of these roles by the admin.
How To Check How Many Views You Have on Your Facebook Post
As an admin, editor, analyst, or job moderator, you can check how many views a post has on Facebook in these simple steps.
- Launch your Facebook application.
- Navigate to the groups tab from the three-line menu icon on the top right of your feed.
- Tap on the group on which you’re assigned a role.
- Scroll to the post where you’d like to know the view count.
- Check the bottom right of the post to see the number of people the post has reached.
If you promoted the post using Facebook ads, you should get an orange bar where you can get an even more detailed analysis of people who viewed the post. For example, you’ll be able to see how many views came organically and which came from the boost by Facebook.
How To Get More Insights From Facebook on a Post
If you’d love to get more than a general count of the people your post reached, you can do without paying for any feature on Facebook. For instance, you can get a complete breakdown of people who viewed your post in terms of the country they’re from, age, gender, city, and device. To do this, follow these simple steps.
- Go to Facebook’s website or launch the mobile app.
- Navigate to the page or group.
- In the page’s menu, tap the “Insights” tab.
- Click on “Posts.”
- Select the post you want to get more insights into.
Facebook will give you details of the people engaging from this tab. So, for example, you’ll be able to tell what demographic is engaging your content, when they’re doing so, and from what devices.
How To Check How Many People Liked/Dislike Your Facebook Post
Facebook’s insights also let you know how many people like or dislike your posts. In addition, it’ll give you a time range, so you’ll be checking cumulated likes on posts within a day if you made multiple posts. This will also show you what likes are organic and which ones are paid for. So if you want to check this, these are the steps involved.
- Navigate to your Facebook page.
- Click on the menu icon.
- Tap the “Insights” tab.
- Click on “Likes.”
- Set a window for the dates/days you want to check.
You’ll see a chart showing how likes were distributed over the selected days. However, if you want to get the cumulative likes or dislikes over those days, scroll down, and you’ll see the “Total page likes” tab with the value in front of it.
Conclusion
With this article, you can check how many views you have on a Facebook post and do more with the insights tab you get on a Facebook page. So, get your insights and utilize the detailed breakdown to build your page better!
Facebook: Can I See Who Viewed My Videos?
by Madalina Dinita 3 Comments
One way to measure the success of a post or video on Facebook is to check how many people have seen it. If they also interact with it, that’s even better. If you often publish video content on Facebook, here’s how you can check who watched your videos.
How to Check Who Watched Your Videos on Facebook
During a live broadcast on Facebook, you can go to the live stream management page to see who’s watching the broadcast. Unfortunately, after the broadcast is over, you can’t see who watched your video while you were live streaming. You can check the number of viewers but you can’t see who exactly watched your video.
As a workaround, you can ask your viewers to interact with you during the broadcast and leave comments on the video.
A recorded version of the broadcast will be available shortly after the live stream is over. Unfortunately, you still can’t see who watches it.
Facebook is constantly changing based on feedback from users. Maybe Meta will soon let users see who watched their videos after the live stream is over.
How Do I See How Many People Viewed My Facebook Videos?
If you shared a video as Public, the number of views is available below the video. But you need to use the Facebook app for Android and iPhone to see the number of views for your videos. Additionally, if you share a video on a Page, there are additional metrics that you can check from a desktop computer.
How to Check Video Stats on Facebook Pages
To check the stats for the videos shared on your Page, go to Insights. Then, click on Videos and check the data.
You can also check insights for individual videos. To do that, go to your Page, and select Publishing Tools (Meta Business Suite).
Then, click on Video Library and select the video you’re interested in. You can check various stats related to that video’s performance such as audience and engagement.
For example, you can check how many people reacted to your video, commented on it, and shared it. Keep in mind that these stats are available for videos with at least 100 views.
You can also check how many times your video was watched in its total length and the number of times the video was watched for at least 3 seconds.
Conclusion
You can only see who’s watching your Facebook Live videos during the broadcast. After the stream is over, you can see how many people watched the video but you can’t see their names. If you’re managing a Facebook Page, you can go to Insights to check the stats for the videos shared on your Page.
Do you often post videos on Facebook? Do you regularly check your video stats or don’t care about them? Let us know in the comments below.
Filed Under: Internet Tagged With: facebook
Reader Interactions
Studying Facebook statistics: key indicators
In order for the time and effort invested in the development of a company or business in social networks not to be wasted, you need to correctly analyze each action taken. With the help of special tools, you can figure out which methods are effective, and which, on the contrary, are useless. In Facebook, thanks to the statistics service, the key indicators of the page are clearly presented. Let's try to understand the community statistics and the data obtained in more detail in our article. nine0003
Facebook "Statistics" subsections
Each company page has a "Statistics" section. A button with a similar caption can be found at the top of the community panel. Clicking on it will open another page. The various sections will be displayed on the left side. At the very top there is a Browse button.
Subsections, which we will consider in more detail:
- "Subscribers",
- Coverage,
- "Publications"
- "Users". nine0021
Indicators of the subsection "Followers"
In this section we can see the indicators of the number of page subscribers. The final figure is visible on the graph. Also here you can see how many subscribers there were in a certain period. To do this, we put down the dates we need in the lines: “Start” and “Completion”.
In the next line, we can see from which sources users subscribed to the page: from a computer, from Recommended pages, from Advertisements, etc. nine0003
Below is a chart showing net subscriber growth - the number of new subscribers minus the number of unsubscribes. On it you can see how many people subscribed through advertising, without advertising, and how many unsubscribed.
The indicators of this section are important for us, as it gives an understanding of how many users have subscribed to us and for what period. And also when and how much unsubscribed. All values give us the opportunity to analyze what any changes are related to. nine0003
Analysis of the Reach department
This subsection contains charts with organic and paid coverage of publications. Organic reach numbers tell us how many people have seen any post from a page for free. Here you can also view indicators for a specific period.
Next are graphs with the number of social reactions from subscribers for the same (indicators above) period of time.
From this section, we found out how many people saw the publication of the page, how many left the “Like”, “Super” mark, etc. How many shared posts or commented on them.
This will help you understand which posts get the most attention and create content that people are more likely to interact with.
Analysis of data in the "Publications" section
Using the data in this subsection, we can find out what time of day and day of the week our audience is online. This will allow us to place publications in accordance with these indicators. In order for the posts to be seen by the largest number of users subscribed to the page. nine0003
Video course by target
The data in the next column "Types of publications" will help us figure out what types of content are most interesting to subscribers.
Data from the last column "Top Posts" shows us popular pages of competitors or pages we liked. In this way, we can track and analyze the statistics of the top publications of competitors and other pages. You can add pages of interest to us in the "Overview" section, "Pages of Interest" column. nine0003
And the main indicators of this subsection are the reach graph, the number of clicks on publications and social reactions under each publication. Thanks to this data, all statistics on the published content of the page are clearly visible. Separately, we can note the ability to track whether users hide the published content or complain about it as spam - that is, what kind of content negatively affects performance.
Data analysis in the "Users" subsection
The last subsection of interest to us in this collection provides an opportunity to study the demographic and age data of the page's audience. Here there is a division into men and women, the percentage of the ages of subscribers, the countries and cities in which they are located.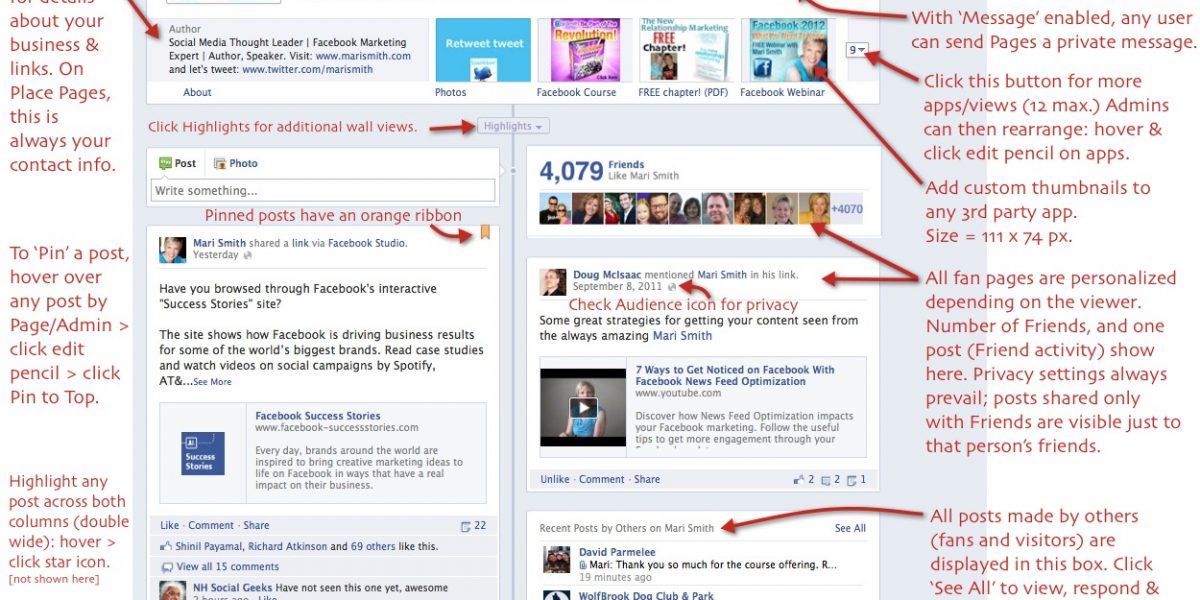 Adjacent columns show demographics of fans and engaged users. nine0003
So, the data of the “Statistics” section makes it possible to find out and analyze information about which audience is interested in the content of the page, which publications on the page people are more likely to interact with. Thanks to all the key indicators, it is possible to improve the published materials. And also increase the number of people who interact with the company through the page. Follow the statistics and create cool content for all users from your page.
Subscribe to our Telegram channel and stay up to date with new articles and other interesting materials. nine0003
On our Instagram channel you will find a lot of interesting things from the life of the Agency and useful materials on SMM and Digital.
There are many videos about SMM on the YouTube channel.
How to view site statistics
View traffic data for your site and analyze its performance. You can view graphs and overall views and conversions.
How to view general statistics
To view statistics, select a site and go to the "Statistics" tab.
On the main page you will see the number of visits for today, this month and all time.
Please note that statistics are displayed for all pages of the site.
How to view statistics on a chart for a selected period
You can choose to display statistics on page views, clicks, subscriptions, or payments. nine0003
Please note that the statistics on the graphs are displayed for all pages of the site.
Next, you can select the period for which you want to display statistics on the chart: week, month, quarter, or your dates.
View statistics
You can view the total and unique number of visits to your site using the visit statistics.
Total visits shows the number of visits; One visitor can visit the site several times.
Unique is the number of visitors or visits of one new visitor for the selected period.
To view pageview statistics for individual pages, click on Detailed View Statistics.
Jump statistics
You can also view advanced click-through statistics for added links on your site. nine0003
At the top of the graph, select "Click-through statistics" and below the graph, click on "Detailed click-through statistics". Opposite each link will be the number of common and unique transitions and the percentage of unique to all transitions.
With the click statistics you can view the total and unique number of clicks on links on your site.
Transitions total shows the total number of transitions; One visitor can visit the site several times. nine0003
Unique is the number of times new visitors clicked on links for the first time during the selected period.
You can also view extended click-through statistics for added links on your site.
At the top of the graph, select "Click-through statistics" and below the graph, click on "Detailed click-through statistics". Opposite each link will be the number of common and unique transitions and the percentage of unique to all transitions. nine0003
Detailed conversion statistics are available on a paid plan. Clicks on the subscribe button and the payment button are not taken into account in the statistics of transitions.
Subscription statistics
With the help of subscription statistics, you can see the total number of subscriptions for a certain day or period, as well as view the conversion.
You can also view extended subscription statistics for added forms on your site:
Visits shows the total number of impressions of subscription forms; One visitor can visit the site several times.
Unique shows the number of times the form was shown to a new visitor during the selected period.
Subscriptions shows the number of subscribed visitors. Also nearby is the conversion rate - the percentage of subscribers from unique visits.
This statistics is available only on paid plans. nine0003
Payment statistics
In the payment statistics you will find the total number of payments for a certain day or period, as well as the conversion rate.
You can also view extended payment statistics by product names in the payment form on your website:
Visits shows the total number of impressions of all forms of payment; One visitor can visit the site several times.
Unique shows the number of impressions of the form to a new visitor for the selected period.
Abandoned carts shows the number of visitors who clicked "Pay" but did not complete the purchase process. Also nearby is the conversion rate - the percentage of abandoned carts from unique visits.


